Many FMs have difficulty getting started in the benchmarking process. Regardless of what benchmarking program or tool you use the task often looks formidable—the quality tools available allow FMs to input lots and lots of data, and just the thought of so much data entry will deter someone from doing anything more. One FM once claimed that the input forms look like the long form of one’s Federal taxes rather than the 1040-EZ (the “easy” form in the U.S. that its Internal Revenue Service now makes available).
It doesn’t have to be that way. Rather, we recommend an approach that allows you obtain the key output reports in the minimum amount of time. The first thing to remember is that with only a few benchmarking values you can see where you stand on about 95% of the operating costs—that’s not a bad way to begin.
Figure 1 shows the 2009 results from about 650 benchmarking participants representing 2008 data. Note that by benchmarking just Utilities, Maintenance, Custodial, and Security costs, these participants are benchmarking 97% of their annual operating costs.

Figure 1. Operating cost expenditures for benchmarking clients. This chart shows that most operating costs are from just four key FM areas. Chart provided courtesy of FM BENCHMARKING.
Once you’ve identified the critical areas to benchmark, the next step is to determine which data fields within those areas you should benchmark. To get meaningful basic reports, one doesn’t need to have access to every type of possible data. For example, just knowing the total cost of your scheduled plus corrective maintenance will give you enough information to compare your maintenance costs to others.
For the utilities, one needs basic annual cost and consumption data (see Figure 2). Security and custodial should focus on total costs. After that, you just need some basic building data (see Figure 3) so you can apply filters, enabling you to compare your building to only those that are similar to yours.
After entering this basic information you will be able to see how you compare your building to other similar ones on the major Key Performance Indicator (KPI) charts of Cost per Area or Cost per Occupant for:
- Utilities
- Maintenance
- Custodial
- Security
This should be able to be done in less than an hour for all four areas above.
|
Summary of Steps to Start Benchmarking |
Examples and Comments |
|
Determine areas to benchmark. |
Utilities, maintenance, custodial, security, landscaping, sustainability, etc. |
|
Identify the key building demographic metrics to study. |
Climate, building size, building type, etc. |
|
Identify the most important consumption and cost metrics to study. |
BTUs, gallons, costs, etc. |
|
Identify relevant best practices. |
Use of occupancy sensors, use of handheld devices for work orders, etc. |
|
Benchmark the above variables. |
This should take less than one hour for the most important metrics. |
|
Identify any additional variables to study over time. |
Break maintenance costs down by trade, in-house vs. outside contractors, etc. |
|
Benchmark the additional variables. |
Can take an additional one to eight hours. |
A good benchmarking system should be able to track a wide variety of data that may be useful. But not all those data will be useful to everyone, and, unless one wants to conduct some very detailed analyses, one can learn a lot about improving FM operations and reducing operating costs by inputting just a small amount of data. You may input additional data later on, should you need it.
FM BENCHMARKING identifies fields for inputting at three levels (see Figures 2 and 3), which makes it very easy for one to see what to input first in order to get meaningful results. FM BENCHMARKING identifies those few fields that are required (mostly basic building demographic data); it then identifies those that it claims will get you basic benchmarking results in just 30-60 minutes (Super QuickStart); it also identifies those that will take you another hour to input (QuickStart), which will give you all you need except for very specific, detailed comparisons.
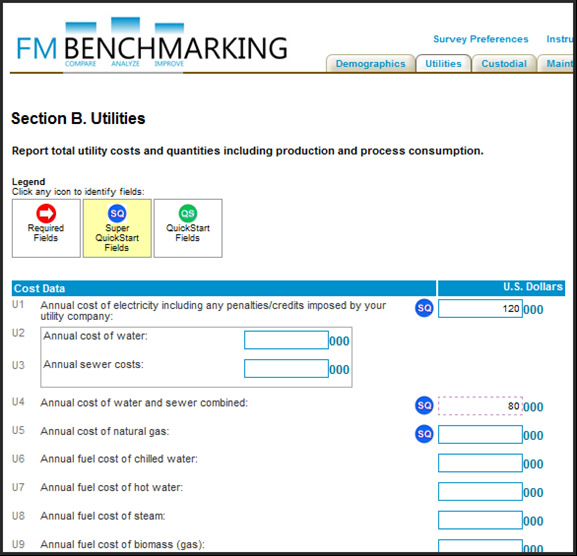 Figure 2. Examples of utilities data. The Blue Circles denote fields that FM BENCHMARKING has identified for its Super QuickStart. Super QuickStart identifies the most critical data from Utilities, Maintenance, Custodial and Security, and are designed to get one up and running in just 30-60 minutes. Chart provided courtesy of FM BENCHMARKING.
 Figure 3. Examples of building demographic data. These later may become filters when one creates reports. The Red Circles denote fields that FM BENCHMARKING requires; the Blue Circles denote fields that FM BENCHMARKING has identified for its Super QuickStart. Chart provided courtesy of FM BENCHMARKING.
By breaking the data down into “intelligent chunks,” one has a structured way of gradually increasing the value of whatever benchmarking tool one is using.
Many data fields, especially those to identify Best Practices in use (not all benchmarking tools have such fields), are simply Yes-No fields and take practically no time to input. If your system has Best Practices, by inputting them, you will not only know where your facility is lagging those of others, but what you can do about it (see the January Benchmarking article on FMLink).
As time goes on, you may input additional data; for example, by breaking down your maintenance costs by craft (e.g., electrical, carpentry, plumbing, etc.), you will be able to diagnose better where your spending may be trimmed, but by taking care of the key data up front, you will begin to obtain value from your benchmarking system in hardly any time. At least you will know that you have a problem in a specific area, such as maintenance. All additional input after that will be “icing on the cake.”