Custodial costs are one of the easiest services Facility Managers can benchmark. What makes it so easy is that for most FM’s it is a contact with a readily definable scope. The information you need to benchmark is the:
- Cost of the custodial services
- Area cleaned
There are other benchmarking metrics that help define the quality of the services and we will get to those a little further in the article.
Step 1—Custodial Benchmarking Definitions
Custodial includes periodic cleaning, special cleaning, and trash collection.
Custodial Maintenance Costs—NOTE: Below is a worksheet only. Line C1 is the only item submitted. Include all costs whether there is a specific function sub-category listed or not. In most organizations, the sum of line C1 will equal the Custodial Maintenance budget. Functions listed in the table below are areas that comprise Custodial Maintenance Costs and are for your use.
| Function | Internal Costs ($000) | Contractual Costs ($000) |
|---|---|---|
| Janitorial | $ | $ |
| Window Cleaning | $ | $ |
| Custodial Uniform Cleaning | $ | $ |
| Other | $ | $ |
| Costs charged to other depts. | $ | $ |
| Administration | $ | $ |
| Supplies & Materials | $ | $ |
| Tools | $ | $ |
| Labor | $ | $ |
| C1. Total custodial costs ($000). | ? | ? |
Cleanable Area—Cleaning is defined as a routine process on a regular basis that is performed by custodial staff. If you have measured the area cleaned for contractual purposes or other reasons then use that value. If your cleanable area is unknown then use the following formula:
Cleanable Square Feet = Gross Square Feet minus walls (1.5% of gross square feet) minus non-cleanable areas (i.e., electrical closets, mechanical rooms, storage rooms).
| Employees(SF 000) | Contractors(SF 000) | |
| C3. Indicate the area cleaned according to the type of crew that cleans it from the above costs. | > | > |
Step 2—How Do I Compare With Others
Once this information is collected it is easy to normalize the data on a unit cost basis to determine how efficiently the cleaning process is being handled. One of the cleaning cost charts in the Facility Managers Roundtable Group would look like this

Each bar on the chart represents a site cost per cleanable square foot. Of noteworthy interest is how consistent the cost structure looks for participants – there are only a couple of sites with very low or very high costs. About half of the participants can be grouped in the range between $1.00 and $2.00 per cleanable square foot. You may also have noticed the diamond symbols on secondary axes. These are customer satisfaction values from the occupancy survey. A better way of looking at this information is shown in the quadrant chart below.
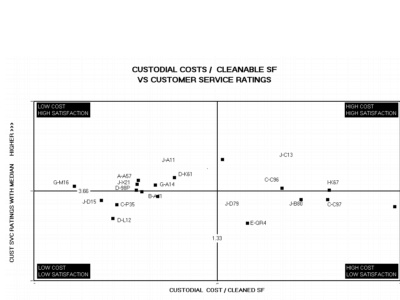
Note that we have identified the Low Cost and High Satisfaction participants with this chart in the upper left quadrant. What can we learn from these results
- First, this is an excellent indicator that the questions are understood by a signification portion of the group.
- The data is collected in a manner that is consistent in the way the question is written.
- It is highly likely that we will find some Custodial Best Practices in this group. In fact, since this group has been benchmarking together and their costs are consistent we can expect that some of the sites have already adopted some of the best practices.
Step 3—Using This Information
You’ve completed your custodial data collection and performed the calculations. Here are a few questions you should ask yourself
- Where do you stand on this chart? Are you above the median or below it?
- Could you explain to management why your position on the chart is just right or needs to be changed?
- What are some of the reasons that explain your position on the chart?
Step 4—Some Best Practices
- Understand your contractor’s production rate. Most of the custodial cost is labor so you need to understand the appropriate staffing level. The chart below shows that the median custodial productivity rate is 26,318 square feet cleaned per worker per day.

- Understand the frequencies of your service. Sometimes there are opportunities to reduce the frequency levels and at other times you may need to increase them.

Are you dusting your offices once a day. Benchmarking survey data shows the most common dusting frequency is once per week. This data can help support your decisions to make changes. - Look for improved technology to increase productivity. One our benchmarking participants acquired pressure washers for use in their restrooms. Occupancy satisfaction ratings went up and costs went down after the implementation.
Metrics from the Facility Managers Round Table (FMRT)
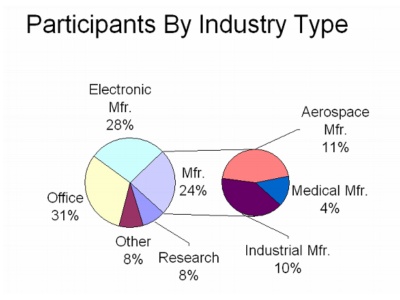
In 2004 there were 94 unique sites in the FMRT with a median size of about 1,400,000 million square feet. See the chart below to see how the group looked by industry type.
Participants By Industry Type
SPACE METRICS
- Space Utilization 430 Gross Square Feet per Occupant
- Cost Metrics
- Utilities $2.17 / GSF
- Custodial $1.33 / Cleanable SF
- Maintenance $1.82 / GSF
- Parking and Paving $1529 / Acre
- Groundskeeping $3405 / Acre
- Security $0.73 / GSF
- Mail Services $0.22 / GSF
- Environmental Health and Safety $0.35 / GSF
- Fixed Costs (Includes: Building, Leasehold Improvements, Furniture/Equipment) $ 3.71 / GSF
MOVE / CHURN COST METRICS
- Box Move Costs $317 / Person Moved
CUSTOMER SATISFACTION
- Satisfaction With Overall Facilities Services 3.80 on a 1 to 5 scale