
Many FMs participate in benchmarking programs to see where they stand in comparison to their peers. To obtain good benchmarking results you need comparisons of similar buildings using filters to select the characteristics of the facility you want to compare.
But there is more to it than simply coming up with the right comparables, seeing how your building performs, and then stopping. After all, the object is to improve. And to improve, there are two more critical components:
- Get a better understanding of which comparables are the “right” ones.
- Determine what it is you can do to improve your building’s performance.
The former involves a heuristic process by which you create scenarios by turning various filters on and off, and seeing which have the most impact. In the second, once we’ve identified the most appropriate filters for our building, we see the impact that various best practices have on improving our building’s performance.
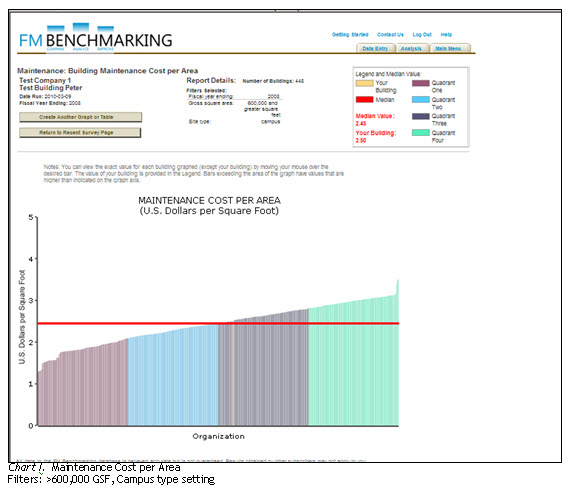
Let’s look at a few examples from FM BENCHMARKING to see the value that filters can bring to the analysis. In this example our facility is a 827,000 gross square foot (GSF) facility, 35 years old, with 1,963 FTEs (full time equivalents) with a primary business function of manufacturing.
The first filter we will turn on is the size of the facility so that we will only consider buildings that are 600,000 GSF or greater and a ‘campus setting.’ In the FM BENCHMARKING system this produces 448 facilities for comparison. In Chart I our consumption is shown by the yellow bar with $2.50 per GSF which indicates a performance just above the median value at $2.45 per GSF.
However, just using the size and campus filters are not a good comparison of our building’s performance. Maintenance costs should be impacted by the type of facility, in this case manufacturing. We should compare our performance with other peers in the manufacturing industry. When we turn on the filters:
- Gross square area: 600,000 and greater Square Feet
- Campus
- Manufacturing
Our peer group median performance is more expensive at $2.60 per GSF. Comparing our performance with other manufacturing type facilities puts our maintenance costs in the second quartile (see Chart II).

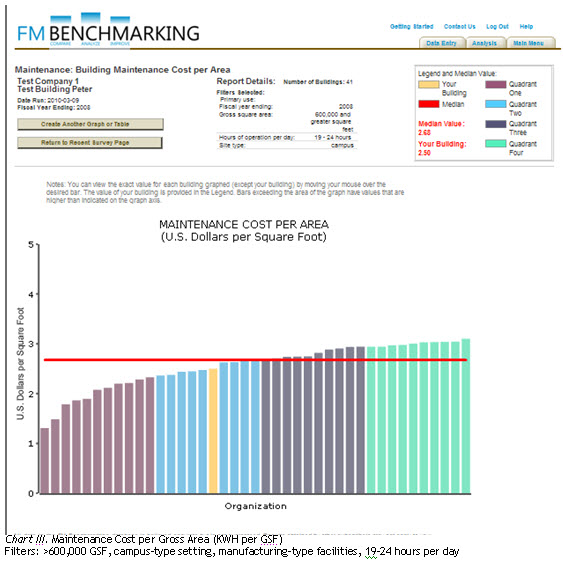
Our facility operates 19 hours per day and that should impact our peer group. When we turn on the filters:
- Gross square area: 600,000 and greater Square Feet
- Campus setting
- Manufacturing
- Hours of operation per day: 19-24 Hours
Our maintenance costs move closer to the first quartile as shown in Chart III.
As you can see, these are significant changes in our ranking position that are made simply by better peer group comparisons from applying filters. Table I shows the effect of adding filters to our output reports.

There is quite a difference in the relative rankings our facility moved from below the median to the middle of the second quartile with a ranking of 37% just by thoughtful application of filters so that our building was compared with true peers.
Now let’s consider what we can do to improve our real performance (i.e., reduce our actual maintenance costs). FM BENCHMARKING provides a very useful tool to integrate best practices responses with the quartile results. In Table II below we answered ‘No’ for selected best practices; i.e., we have not implemented those best practices.

This very valuable feature shows the percent responding Yes in our quartile and the next better-performing quartile. This makes it very easy to see what actions we might take to improve our performance. For example, everyone (100%) in the next better performing quartile indicated they had a contractor selection process that assures work is performed per standards, while only 73% of those in our quartile had done it. This may be an item we should consider carefully for our facility.
In conclusion you can see how the application of filters can impact your relative rankings in a very significant way. This allows for comparisons to a more similar peer group and is a much more effective way of using benchmarking tools. After we have established our peer group we are able to identify the Best Practices that would further improve our performance.
Benchmarking is indeed an ongoing process and cannot be looked at in a vacuum. Without properly applying the filters, there will be too many variables to gain any further insight. But once the correct filters are applied, one then can apply information to integrate best practices into the model, and at that point, one can identify ways to truly improve building performance.