I was reviewing my notes from the recent IFMA Facility Fusion conference, held in Washington DC. We experienced a lot of traffic at the FM BENCHMARKING booth and a frequent question was, “Why do I need to use anything more than Energy Star?” It seems that many of our booth visitors, and probably many FMs that are reading this article, have difficulty separating out the difference between a full benchmarking tool and the Energy Star application provided by the EPA.
Energy Star is a good application and most of FMs will benefit by providing data so that they could calculate their Energy Star score. What the score tells you is that you are performing better than that percentage of others.
But, what do you do after you’ve got your score? Is 85 a good enough score or would your company be happy with 65? What if your score were a 65 and your boss wanted it to be better? How would you do that? That’s where a full application for benchmarking can benefit your organization.
Another shortcoming of Energy Star is that it has a limited number of filters to compare similar buildings. Even if you know your buildings is an old office building (and you filter out other types of buildings), what if it has 25% of it occupied by a data center? What if is open 24 hours a day for five days a week and 12 hours a day for two?
So what is the value of Energy Star? It has a large database, and it definitely will get you into the right ballpark for you to see how your building is performing in general. It’s similar to saying that your car gets 22 miles to the gallon—is that good or not? If your care is an antique you have a filter that addresses age and another that you’re doing mostly city driving, you’d find that your car is doing pretty well; but if your car is a new hybrid, perhaps not. But if you don’t have those filters, you’re only in the ballpark—you need a more complete benchmarking solution with more filters to see what you can do to improve.
To put it another way, Energy Star can help you identify whether you can likely find ways to improve your building’s energy performance, but it can’t really tell you what to do.
One of the reasons that full-scale benchmarking is perceived as complex is that the forms and the amount of data needed for benchmarking look complex but most of the critical information should be readily available. If you already have your data organized so you can submit it for an Energy Star rating, then you will have almost everything you need to submit to a full benchmarking application.
I suggested an approach to help the booth visitors get started. Below, I use examples from FM BENCHMARKING to illustrate how easy the process is, but this approach should work with almost any full benchmarking program you may become involved with. This approach allows you to obtain the key energy utilization reports in the minimum amount of time.
The data submittal form (Figure 1) looks lengthy but there are only two fields that most FM’s will need to fill in. They are:
- UN01 – Annual consumption of electricity from your utility company
- UN08 – Annual quantity of natural gas consumed for building use.
The rest of the form is used to collect information for buildings that are located in the district heating or cooling system or other conditions where perhaps the electricity is generated on site. The two items above are considered “critical” data fields. By inputting these critical data fields you will be able to see how your performance compares with others on most of the key performance indicator charts in the shortest possible time.
There are two other inputs on the Building Attributes input form that will be needed. These are
- Gross Area of the facility
- Number of occupants
This info is needed so the application can normalize the data. Normalization of the data allows for comparisons on a cost per area or cost per occupant basis.

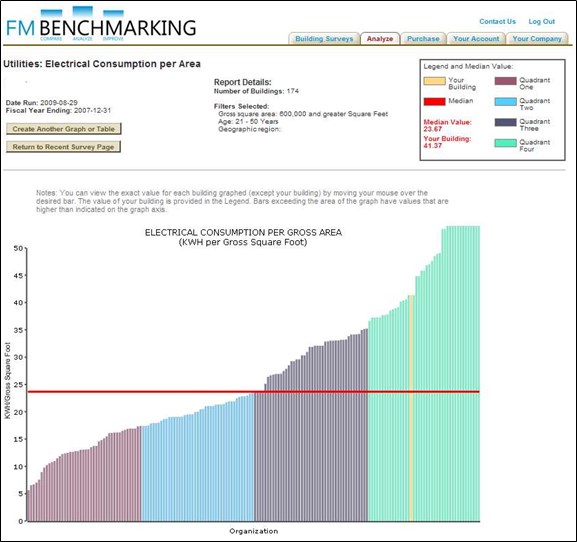
In Figure 2 you can see that our building is in the fourth quartile for electric consumption per gross area. If we submitted this info to Energy Star we would obtain a score of 21 for electrical consumption. That is a poor score but Energy Star will not tell you anything about what you should do to improve that score.
To improve your score you need to know what to change in your facility. One way to do that is to compare what others are doing to your practices. Here is a partial screen shot of the best practices input section:
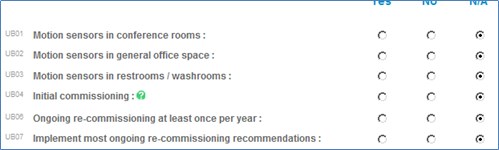
What does a facilities manager obtain after entering this basic information? For just a little bit extra of your time, you will receive quite a bit of valuable feedback on which best practices would have the most benefit to improving your building’s performance.