February 2017 — Last month we reviewed how organizations with large quantities of properties can use benchmarking to their benefit and focused on energy and utilities, see Large portfolio benchmarking: Utilities. An organization, with a large number of facilities in their portfolio will usually have multiple facilities of similar types that can be benchmarked comparatively—this applies not only to benchmarking utilities but maintenance costs as well. Besides organizations with considerable office space, other such organizations include:
- Retail branch banks
- Data centers
- Call centers
- Healthcare: Hospitals, physician’s offices, etc.
- Back office facilities
- Headquarters or Class A office space
- Malls
- Retail: Grocery, pharmacy, big box, etc.
These types of organizations can use benchmarking and benefit in a number of ways:
- Multiple facilities of similar types that can be benchmarked against each other to see which ones may need attention.
- Similar facilities, including those of competitors, can be benchmarked[1] to learn whether they should take action to reduce costs.
- Best practices either from internal or external benchmarking can be identified.
- Operating performance of the entire organization is improved by applying the identified best practices.
In our work, with these large portfolio organizations, there frequently identified reasons for participating in the benchmarking process:
- Justification of operating efficiency
Facility Executives need good data to show which facilities are operating in an efficient manner. This is a recurring request from the “C” suite as budgets are approved and capital projects are reviewed. Benchmarking data can be used in a variety of ways. Just a few are listed below:- Shifting production or resources to more efficient sites.
- Promoting facilities managers who are managing high preforming facilities.
- Justifying capital expenditures.
- Identifying high-, medium-, and low-cost operating profiles.
Many of our clients hold regular FM forums internal to the company to share their practices within the organization. Hopefully your organization isn’t a high-cost performer and you are asked to explain why you are doing so poorly. The low-cost performers are usually asked to share what they are doing so the rest of the organization can benefit. Internal benchmarking is really the easy first step.- No confidentiality issues.
- The participants probably know each other’s facilities.
- A common cost reporting system.
- Easy exchange of data.
- Organizational cost pressures
Nearly every organization is under some pressure to perform better year after year. If you are not experiencing this pressure, then you are among the lucky few with unrestrained budgets and personnel. Most FMs have had to cut back – they are looking for ways to keep the facilities running without degrading services. Benchmarking of large organizations, whether internal or external, is a very helpful process that shows and justifies their cost structure. Consider several possibilities based on where your performance benchmarks:- 1st quartile (top 25% of benchmarked companies)
Explain and justify that further costs reductions can only be obtained by degrading either services to the occupants or reducing the service life of the facility. If you are in this region then you really can use benchmarking to mitigate some of the pressure to reduce costs. - 2nd or 3rd quartile
Your costs could be better and you should begin working with your peers that are in the 1st quartile to improve your operating performance. - 4th quartile
It is good to know where you stand and the great opportunity to improve the performance of your facilities. Maybe they have been underfunded in the past and are in terrible shape. You just need to start working with the peers that are performing at a lower cost and set firm, but achievable objectives. Poor performance can often be used to help justify additional funding.
- 1st quartile (top 25% of benchmarked companies)
- Using Benchmarking as a “change agent.”
Most large organizations struggle to make organizational changes across the entire enterprise. Benchmarking can provide cost comparisons that are hard to hide behind and help justify changes that improve operating efficiencies.
Much like any other facility organization, large organizations have the same issues getting started with benchmarking. Most organizations have experienced staffing cuts and the remaining staff is busy. But benchmarking is a program that needs to happen. Without good benchmarking comparisons, large organizations may not realize which facilities have a high or low cost profile and sharing of best practices will be lost. Benchmarking is a rare opportunity to improve the whole organization and improve operations without just “getting by with less.”
Is benchmarking worthwhile?
The benefits to benchmarking certainly outweigh the negatives and here is a suggested approach to help you to get started. Some examples below illustrate how easy the process should be. This approach will allow you obtain the key output reports in the minimum amount of time.
First of all, benchmarking can be an intensive effort so focus on what is most important! A quick review of your budget will show that:
- Energy and utilities
- Maintenance
- Janitorial services and
- Security
usually represent the largest share of your operating expenses, with two-thirds of the total in the first two items listed. These four components typically represent, for most facilities, between 95 and 97 percent of your controllable operating expenses. If utilities and maintenance haven’t been carefully benchmarked in the past year or so, they will have the highest potential for savings.
Maintenance is nearly always normalized on a cost per area basis and a cost per occupant basis. In this example we will compare a vertical financial services organization on their cost per area basis. It is also important to compare the normalized maintenance costs with a relevant peer group. Figure 1 shows the maintenance costs using the filter criteria listed below for multiple buildings in a company’s portfolio (each company building satisfying the filter criteria is shown in yellow; other companies’ buildings are shown in the other four colors. With each color representing a different performance quartile).
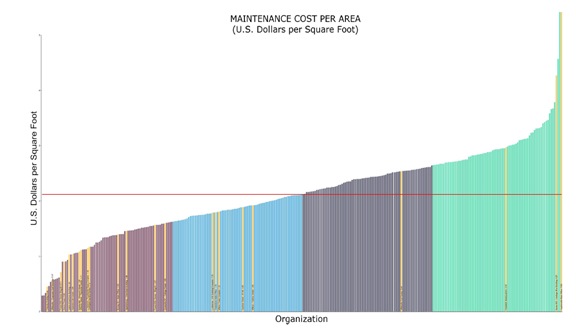
Figure 1 – Maintenance Cost per Area
Filters: Type of facility (Financial Services, 125,000–600,000 GSF)
Provided courtesy of FM BENCHMARKING
Figure 1 allows you to see at a glance how your facilities compare with other financial services facilities. There are 322 buildings in this peer group with a median utility cost per square foot of $2.18 (red line between 2nd and 3rd quartiles) and a 1st quartile performance of $1.78 per square foot.
The yellow bars indicate the financial services facilities in the benchmarked vertical. Note that most of the facilities for the subject company are in the first and second quartile, but there are two facilities in the third quartile with three facilities in the fourth quartile. The highest cost facilities at the far right of the fourth quartile are really worth looking at. Prior to the benchmarking program the management team thought they were doing “just fine.” This is just one example of the power of benchmarking to produce organizational changes.
To reach second quartile, or move the high cost facilities into the third quartile you could begin looking at the best practices and the implementation rates. In this example we ran the implemented best practices for the highest cost facility, the one at the far right of the chart, to see what it had done. Figure 2 below shows no implementation for any of the first five best practices. It also shows the implementation rate for the 4th quartile and 3rd quartile groups. These best practices shown in Figure 2 are only some of those included with FM BENCHMARKING (there are about 30 best practices overall for maintenance).
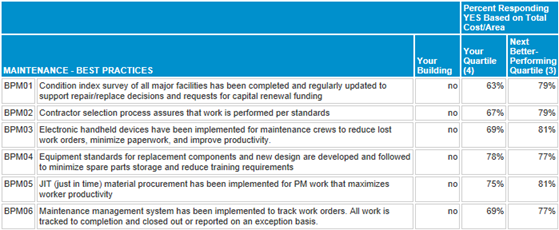
Figure 2 – Maintenance Best Practices
Type of facility (Financial Services, 125,000–600,000 GSF)
Provided courtesy of FM BENCHMARKING
After reviewing just this data we concluded that it should not be too difficult to radically improve the performance of the high cost buildings, as over three quarters of those in the 3rd quartile had implemented these five best practices. Using the results from this table, the facilities group can make proven recommendations for maintenance services that would help achieve significantly improved performance or move toward first quartile performance.
Again, this is win-win for the entire organization. The company will achieve cost savings from the maintenance improvements and improved levels of service; the FM organization will improve its profitability by more effectively utilizing its workforce, and there will be improved occupant satisfaction which benefits everyone.
[1] However, a good benchmarking tool should contain many facilities in its database, including those of one’s competitors, but it should not state the names of any other organizations who are benchmarking, as all such data must remain confidential.