April 2017 – In last month’s article, we discussed utilities benchmarking for outsource providers. In this month’s article, we will cover maintenance benchmarks.
Please also see last month’s article for some general information about benchmarking for outsourcing providers.
Maintenance costs are usually right behind the utilities costs in terms of magnitude. Building owners and facilities managers are very interested in the metrics and Key Performance Indicators (KPI’s) for those services need to be benchmarked. We will cover the KPIs for maintenance KPIs in this article. Subsequent articles will cover janitorial KPIs for service providers.
Maintenance performance is benchmarked on a gross area basis. Since, for most buildings, the maintenance work is a major component of the total facilities costs, we usually look at normalized maintenance effort (Maintenance Cost per Gross Area).
Comparing your maintenance costs/gross area may give you the wrong perspective on your performance unless the comparisons are made with a relevant peer group. For a quick comparison, we used FM BENCHMARKING’s Query Edition to create a chart showing the Maintenance costs/area of a good peer group. Figure 1 shows the Maintenance cost/area for office facilities.

Figure 1 – KWH usage per GSF
Filter: Primary Use: Office
Provided courtesy of FM BENCHMARKING (Query Edition)
This allows you to see at a glance how well your facilities are performing maintenance activities compared to other office buildings. There are 430 buildings in this peer group with a median maintenance cost of $2.26/GSF and a first quartile performance of about $1.73/GSF (the border between the first two of the four quartiles).
By looking at, and comparing similar types of facilities, you will be able to make intelligent “data driven” decisions. The outsourcer, for this example, has totaled its annual maintenance costs and divided by the Gross Square Feet to determine the annual cost at $2.10/GSF, which is in the second quartile. This is an opportunity for the outsourcer to propose some additional maintenance improvement projects to the owner. This has the potential to earn additional fees for the outsourcer while reducing costs for the owner… A WIN_WIN for everyone. Of course, even though being in the second quartile means there can be improvement, it is not bad either, so the outsourcer can show its client that it is doing better than most organizations.
Using benchmarking such as shown in Figure 1 gives the outsourcer an idea of the performance of a good peer group but it doesn’t directly show their buildings’ individual performance or provide a table of the implemented best practices by quartile (the best practices can show the outsourcer how to improve the results, as shown below). For that we we’ll use a different tool.
This tool shows at a glance how well an individual facility is performing maintenance (see Figure 2). There are 431 buildings in this peer group, the same as in the Query chart. However, this time our building is shown (notice the yellow line just above $2 per Gross Square Foot). By applying more filters, such as office size and hours of building operation, you may get even more applicable benchmarking results.

Figure 2 – Maintenance Cost per Gross Area
Filters: Primary Use: Office
Provided courtesy of FM BENCHMARKING (Starter Edition)
To reach first quartile you could start by:
- Reducing the number of maintenance workers
- Reducing the PM program
- Buying more used parts to reduce costs
However, none of these steps will provide a better work environment for the occupants. Rather, although you will save money, you also likely will receive more complaints.
A much better approach to get into the first quartile would be to evaluate which best practices other organizations in this peer group have implemented to reach the 1st Quartile performance level. Figure 3 shows some of the best practices you have implemented in our sample building, what has been implemented by the peer group in your (second) quartile and the next better (first) quartile. Figure 3 is only a partial list from FM BENCHMARKING; there are about 40 best maintenance practices overall.
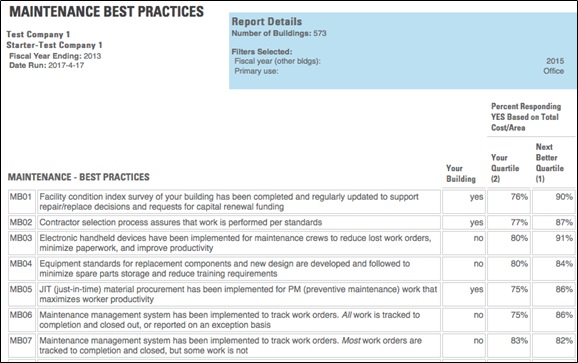
Figure 3 – Maintenance Best Practices (partial list)
Filters: Size: Primary Use: Office
Provided courtesy of FM BENCHMARKING
Using the results from this table, the outsourcer can make proven recommendations for Maintenance projects that would help achieve first quartile performance. Again, this is win-win-win for the outsourcer, the FM and the occupant. The FM will achieve cost savings from improved maintenance practices; the outsourcer will earn additional fees by implementing projects; and there will be improved occupant satisfaction, which benefits everyone.