Measuring Your Space Utilization Performance How to apply benchmarking data (without inputting your own data) to see if your building needs a more in-depth analysis
Many FMs are seeking benchmarking data to measure how their organizations are performing. One of the problems they encounter is having enough time to collect and input data for a comprehensive benchmarking survey.
What this group of FMs really wants is a table or chart showing the key operating metrics of a good peer group to compare with their performance. Then, depending on the findings, they may or may not be interested in the next steps, which usually are to identify ways to improve. In other words, if their buildings are already one of the top performers, there may be no need for them to focus further attention on the benchmarking exercise.
Now, there are some tools available to answer these questions, where one does not have to input data. Let’s look at some of what one can do in order to conduct such an initial assessment.
One of the most important KPIs (knowledge and performance indicators) centers around space utilization. The key metric here is Gross Square Feet per Occupant. Most other benchmarking metrics focus on improving an operating cost in a specific category. For example, you may feel very productive if you reduce your maintenance cost by 10% which translates to maybe $0.20 to $.40 per GSF US. What if, instead, you could reduce the portfolio size by 10%. That would produce a savings of $6 to $12 per GSF. So the first KPI to look at is GSF per Occupant.
First, the FM must realize that not all space utilization charts provide a realistic picture of your benchmarked costs. Comparing data or even processes isn’t a very effective way to improve your performance unless the comparisons are made with a relevant peer group. Below, our first example is a chart showing the GSF / person for all facilities greater than 600,000 GSF located in a suburban setting.

The data presented in Figure 1 allows you to see at a glance how well your facilities are utilizing their space. Organizations in this peer group have a median space utilization of 509 GSF per person with a first quartile performance of under 400 GSF per person. By looking at and comparing similar types of facilities you will be able to make intelligent “data driven” decisions.
But there are a lot more filters we can add to the peer group than just the size of the facility. For this example let’s assume we are a manufacturing facility and see what happens when we add “Manufacturing” types of facilities to the filters.
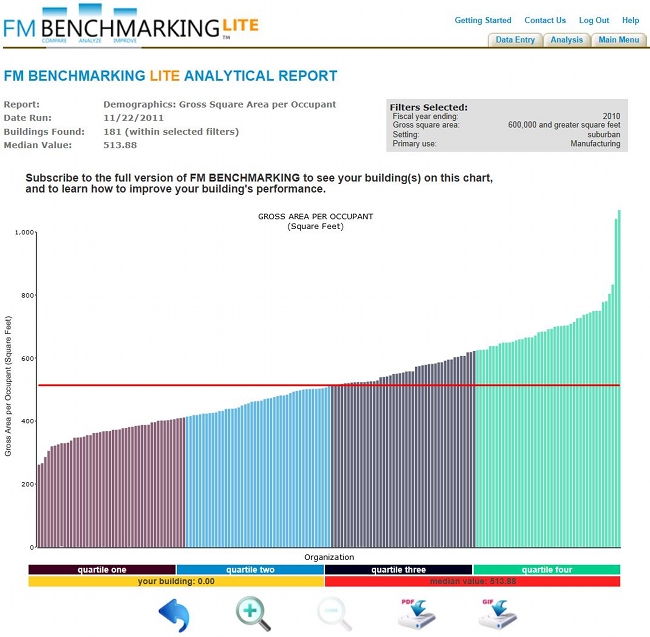
Figure 2 shows a slightly higher median space utilization of 514 GSF/person which is consistent with what is expected for manufacturing type facilities. Additional filters could be applied to show how space is utilized at different types of manufacturing facilities until we are satisfied that the peer group is valid.
From here, decisions can be made that can significantly change the operating cost profile of the facilities portfolio, all without having to go through the process of collecting benchmarking data and submitting it.
Products such as FM BENCHMARKING LITE are a good way to make an initial assessment in a very quick and easy manner. One doesn’t have to put in any of a building’s data, and as long as the product offers enough filters to enable appropriate peer comparisons of similar facilities, you will know very quickly whether further benchmarking efforts are warranted. If your facility performance is in the third or fourth quartile you may need to investigate and benchmark further to determine the next steps to take.
1FM BENCHMARKING Lite enables one to look up data from peer groups without having to input data from one’s own buildings.