Many FMs participate in benchmarking programs only to find that they have difficulty developing good comparisons for their facility type. Having access to ample data with good filter sets is key to making the right comparisons. Let’s look at a few examples from FM BENCHMARKING to see the value that filters can bring to the analysis of your benchmarking data.
For example, if you are comparing your facility’s custodial costs you might not know which filters are the most relevant. Let’s take a look at some examples to see what makes a difference.
We might want to see how the size of a facility impacts custodial costs. Larger facilities may have a scale factor that results in lower costs so we may want to look at just facilities that are larger than 600,000 GSF (see Figure 1).
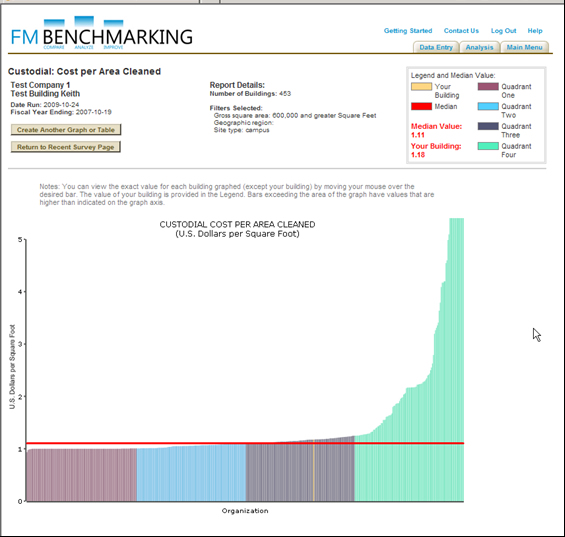
Figure 1: Custodial Cost per Square Foot. This chart shows the unit cost of custodial services for facilities that are greater than 600,000 sq. ft. The ‘subject building’ is shown in yellow, and appears in the middle of the Third Quartile (custodial cost is $1.18 per sq. ft.). The median custodial cost for all buildings being compared is $1.11 per sq. ft., and is shown by the horizontal red line.
What happens to our ranking if we compare our costs with only those companies using a represented (union) work force? Most FMs would expect that a represented work force costs more but according to this filter the median cost is slightly less at $1.08 per GSF. In this example our ranking moves to the top of the third quartile (see Figure 2).

Figure 2: Custodial Cost per Square Foot for companies with Labor Unions. This chart shows the unit cost of custodial services for facilities that are greater than 600,000 sq. ft. when they have labor unions. Because another filter has been applied, there now are few buildings being compared.
In the next example, we take the same facility but filter for those in a similar age grouping to our subject building: 21-50 years. So instead of a sample size of 111 facilities without the age filter, we now have a sample size of 51 with the age filter. This is still an adequate sample size for good comparisons (see Figure 3).

Figure 3: Custodial Cost per Square Foot with Older Facilities and Labor Unions. This chart adds the filter of older buildings (ages 21-50 years) to the filters applied in Figure 2. The median cost has dropped a bit ($1.06), but the drop may not be significant. However, it was enough to move the subject facility into the fourth Performance Quartile.
Conclusions
Some things we’ve learned from applying various filters in our example that may affect management focus:
- There is very little difference between a union and non-union workforce. This may not apply to all facilities but in our example it doesn’t appear that union issues are a major factor in costs.
- We didn’t expect the age of the facility to have much impact on cleaning costs, and there wasn’t much.
However, if one of these filters did have an impact, we would have a better understanding of why the subject facility may incur higher or lower custodial costs than other facilities. This may be useful for several reasons:
- We may have an explanation as to why our costs are higher or lower than those of other buildings.
- We may have identified something that could be modified to lower our costs. For example, if we apply a filter that shows the impact of having a CMMS system can reduce costs, and if we don’t have such a system, this type of Filter Analysis indicates that we should consider acquiring such a system.
As you can see filters are powerful tools to enhance your benchmarking value. By applying filters that are appropriate to the benchmarking metrics under consideration, you can enhance the value of the process and be sure you are making valid comparisons.