November 2015 — Utility costs and ways to reduce them are a top priority for almost all facilities managers. A quick look at the budget or last year’s costs makes this priority easy to understand. Utility costs are almost always the largest single expense of any operating budget and usually comprise about a third of total operating costs. Facilities managers who are looking to improve their budget performance need to focus on utility costs.
Benchmarking utility consumption and costs is a critical first step. This is really the easy part since:
- The data should be readily available from your utility bills.
- Most facilities have to deal with only electricity and natural gas to identify the majority of your utility costs.
- Even if your facility receives energy from a district cooling or heating loop, the data should be resolutely available.
- The gross area of your facility is all that’s needed to normalize your data.
Figure 1 shows a screenshot showing a typical benchmarking data input form for utilities.
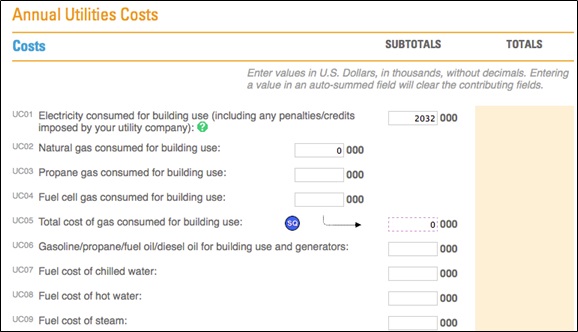
Figure 1 –Annual Utilities Costs. Provided courtesy of FM BENCHMARKING.
This data, along with the gross area of the building, allows for normalized cost comparisons of your utility costs. We can apply additional filters when running reports so that our data is compared against similar types of facilities. That way, we can be sure we are correctly analyzing our facility performance.
Since our building size is larger than 600,000 square feet and is an office facility, we’ve turned on those two filters to see how we’re doing. Figure 2 shows our building to be in the third quartile, almost at the median, with a utilities cost of $2.76 per square foot.

Figure 2 –Annual Utilities Costs per Area.
Filters: Type of building: Office; size of building: greater than 600,000 sq. ft.
Provided courtesy of FM BENCHMARKING.
Some facilities managers may be content with this middle-of-the-road performance. Other FMs would just start shutting off the lights and raising or lowering the temperature, depending on the season, to reduce costs. However, there may be best practices that could be implemented which could reduce costs, move our facility into the second quartile, and minimize the impact on the occupants. Let’s take a look at which best practices have been implemented by those in the second quartile compared with those in the third quartile.
In Figure 3 are the first six best practices from the FM BENCHMARKING application in the Utilities section. There are more than 40 best practices in the application so this is just a partial listing. There is no data shown for question UB05 since it is a new best practice and there’s insufficient data in the system (FM BENCHMARKING adds new best practices and reports throughout the year).
Best practices are an effective, proven way to improve performance in a positive manner for your occupants. To improve your performance you need to know what to change in your facility and a good way to achieve maximum benefit is to compare what others in similar buildings are doing. FMs should carefully analyze which best practices would have the highest return on investment and the highest potential for reducing utility costs. By applying these, you are sure to improve your performance. From the Table below, it appears as if initial and ongoing re-commissioning, as well as motion sensors I restrooms would be a good place to start; of course, one needs to analyze the remaining best practices not shown on this chart, but this type of approach will clearly yield positive results.
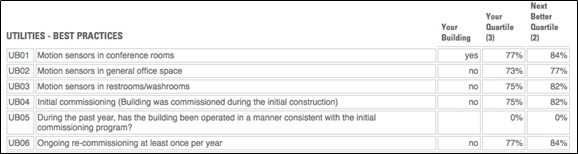
Figure 3 – Utilities Best Practices Provided courtesy of FM BENCHMARKING