July 2018 – This article is the third in a series showing how best practices tools can be used to improve janitorial performance. By benchmarking the janitorial performance and applying specific filters you will see which janitorial best practices have the most impact.
Other articles in this series include:
Based on Figure 1, the janitorial cost for our facility is $1.88 per cleanable square foot and the median value is $1.39 per square foot. Janitorial costs are normalized by the cleanable area, not the gross area, since equipment room spaces and similar type spaces are not usually cleaned. Our building’s cost is shown in yellow and is in the fourth quartile. Clearly costs can be improved or the scope of the services is unusually high for an office type facility. Usually there is a reaction to this type of cost profile but there is a better approach. It is obvious that improvements can be made but we need to evaluate the best practices to see which would be the most effective at improving performance.

Figure 1 – Total janitorial cost per GSF
Filters: Type of facility (Office)
Provided courtesy of FM BENCHMARKING
This is where benchmarking of best practices can lead us to make good decisions on which programs would have the most impact.
Figure 2 shows the percent of Janitorial Best Practices implemented by the peers in our building’s quartile (4) compared to the percent implemented by the next better-performing quartile (3).
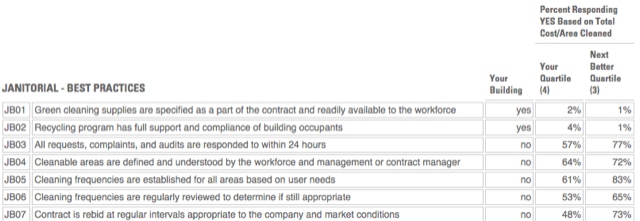
Figure 2 – Janitorial Best Practices
Filters: Type of facility (Office)
Provided courtesy of FM BENCHMARKING
Our first observation is that the facilities team may have focused on green initiatives (the first two best practices), but these may not have much impact on the cost profile. There is such a low rate of implementation that it probably makes sense to focus on another issue. Of course, this does not mean that green initiatives do not have other merits, but they do not seem to impact cost in this type of facility.
Based on the percent of implementation difference it would seem that “JB03 – All requests, complaints, and audits are responded to within 24 hours” would have the greatest impact since it has a 20% difference between quartiles. Another good best practice candidate would be “JB05 – Cleaning frequencies are established for all areas based on user needs.” This has a 22% difference between the fourth and third quartiles.
Finally, look at “JB07 – Contract is rebid at regular intervals appropriate to the company and market conditions.” The difference between the fourth and third quartiles is really significant with a 25% spread. Perhaps the real problem with the cost profile is that the contract has not been re-bid for a long period of time. Many facilities end up paying extra money by just renewing the existing contract at the end of the term without re-bidding it.
Only a few best practices have been discussed here. There are 27 janitorial best practices in the module, and others show equally high percentage variations. Clearly this is an effective way to identify options that would provide successful results to improve performance. Depending on the filters used, the results are often quite different; in this situation, we only applied filters for office buildings—there are many more filters that can impact the bottom line, such as hours of operation, hourly rate for janitorial workers, level of desired cleanliness of the facility, etc. The benchmarking tool can be used to turn on and off multiple filters to ensure the best match for your facility.
More information can be found at www.FMBENCHMARKING.com including a free demonstration tool where you can input your facility data and see some benchmarking results.