March 2019 — Maintenance costs are usually either the second or first highest cost component for most FMs; electricity is the other. So, many FMs are looking for options that would improve the efficiency of their maintenance organization, usually to improve the overall maintenance levels or to reduce costs, or both.
If you have participated in a benchmarking program you may have found it difficult to make good comparisons unless your building is very simple. For example, hours of operation, occupancy density, age of mechanical systems, union or non-union workforce, size of the building, and many other factors can have a significant impact on maintenance costs. Having access to ample data with good filter sets is key to making the right comparisons. Here are a few examples from FM BENCHMARKING that show the value that filters can add to the analysis of your benchmarking data.
Our building is an office facility and it would make sense to compare only with other office facilities. Figure 1 shows 343 office buildings in our data base with a median maintenance cost of $2.45 per GSF (gross square foot), denoted by the horizontal red line. Our building’s maintenance cost is shown in yellow, just above the median at $2.46 per GSF.

Figure 1 – Maintenance cost per GSF
Filters: Type of facility: Office
Provided courtesy of FM BENCHMARKING
By using a second filter we will see how the size of a facility impacts maintenance costs (see Figure 2). Our building is 220,000 GSF, a mid-range size for a facility, with a scale factor that usually results in lower maintenance costs. We will filter for buildings that range in size from 125,000 to 600,000 GSF.

Figure 2 – Maintenance cost per GSF
Filters: Type of facility: Office; Size: 125,000 – 600,000 GSF
Provided courtesy of FM BENCHMARKING
As expected, the median cost for this filtered range with only mid-sized buildings, is $2.00 per gross square foot with a sample size of 121 buildings. Our facility is shown in yellow, with the same maintenance cost of $2.46 per GSF but has slipped to mid-range of the third quartile. The reason for this if that some of the more costly buildings to maintain in Figure 1 are smaller, and they were removed from Figure 2 when the Size filter was added.
Next, let’s see what happens if we add another filter, and only compare our costs with newer buildings. Our building is 6 years old so we will compare it with buildings that are between the age of 4-10 years (see Figure 3).
This results in an even worse benchmark for our facility. Again, our facility costs are unchanged ($2.46 per GSF) but the median maintenance cost for these newer buildings is even better at $1.70 per GSF, and many of the older buildings that were more expensive to maintain are no longer shown with this age filter applied. This comparison benchmarks our facility in the fourth quartile.
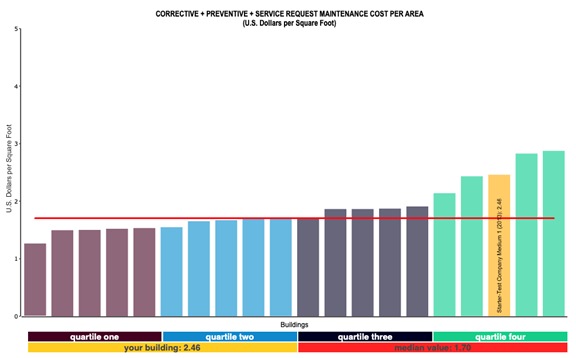
Figure 3 – Maintenance Cost per GSF Provided courtesy of FM BENCHMARKING
Filters: Type of facility: Office; Size: 125,000 – 600,000 GSF; Age: 4-10 years
Provided courtesy of FM BENCHMARKING
What we’ve learned from applying various filters in our example that may affect management focus:
- If we just compare our costs with other office facilities our costs are at about the median, ok but not great.
- Just comparing with office facilities doesn’t provide the whole story. Our facility is newer and smaller so we should have lower costs than just “all office” buildings.
- We should examine the maintenance functions provided and determine what is contributing to the higher cost profile.
It is important to select the right filters when benchmarking. Of course, by turning on too many filters, you don’t end up with enough buildings in your report to get meaningful comparisons. The best solution is to try additional filters one at a time. If your building appears to shift significantly left or right, a newly applied filter is considered significant and should be retained; but if your building stays in about the same place, you will be better off removing that filter and trying another. The object here is to apply as many filters as you can that are meaningful while still having enough buildings in the report to yield accurate results. We like to see at least 20-25 buildings in a report for it to be considered accurate enough to act on.
As you can see filters are powerful tools to enhance your benchmarking value. By applying filters that are appropriate to the benchmarking metrics under consideration you can enhance the value of the process and be sure you are making valid comparisons.