Vertical facilities can benefit from benchmarking in a number of ways. First, a definition of “Verticals” is in order. Verticals are large organizations with multiple facilities of similar types that can be benchmarked comparatively. Verticals exist in nearly all industries such as healthcare, financials, retail, manufacturing, etc.
Here are the most frequent reasons cited by verticals for benchmarking:
- Verticals need good data to show which facilities are operating in an efficient manner. Benchmarking information is a key element of this process.
- The facilities with low-cost operating profiles can share their practices within the organization so the entire portfolio can benefit.
- Facility Managers of individual properties or groups of properties are under continuing cost pressure and are always looking to control costs and reduce operating expenses. Benchmarking data can support their cost position. If you are already in the low-operating-cost 1st quartile and providing good quality services, you can explain this to the management team and mitigate some of the pressure to reduce costs. If your costs are high then you should begin thinking of ways to reduce them and still maintain profitability.
Because verticals in for-profit industries (e.g., retail, pharmaceuticals, banks, etc.) are highly competitive, the savings of a few cents per square foot can become very important. - Many verticals benchmark their costs across the portfolio but run comparisons on similar types of facilities. In the financial industry it is common to benchmark administrative, retail facilities, data centers, call centers, and mail centers as common types of facilities. All major financial institutions have more than one of these types of facilities so benchmarking comparisons are meaningful.
Verticals have the same issues getting started with benchmarking as CREs and FMs and other contractors:
- Everyone is busy, sometimes doing more than one job and the press of daily issues and problems often keep the benchmarking initiative from beginning or progressing. Without good benchmarking comparisons, verticals may not realize which facilities have a high or low cost profile.
- Another issue is the perceived complexity of benchmarking. It seems that regardless of what benchmarking program or tool you use, the task often looks formidable. If you are a service organization interested in benchmarking facilities for multiple clients, when collecting data from the different organizations, some information regarding space or headcounts may not be readily available.
- Finally, many benchmarking forms are frequently not user friendly so no one usually volunteers to “benchmark” unless they can see the benefits.
All of these issues easily can be overcome and the benefits to benchmarking certainly outweigh the negatives. Here is a suggested approach to help you to get started.
First, focus on what is important. For verticals, what is important are the services included in your scope of work. A quick review of your budget will show that
- Energy and utilities
- Maintenance
- Janitorial services and
- Security
represent the largest share of your operating expenses. These four components usually comprise, for most facilities, between 95 and 97 percent of your controllable operating expenses.
Janitorial services are compared on a cost per cleanable area basis. Since, for most janitorial contacts, the labor utilization is a major component (typically more than 80 percent), we usually look at labor utilization.
Comparing your cost per cleanable area may give you the wrong perspective on your performance unless the comparisons are made with a relevant peer group. Here, for example, is a chart showing the cleanable cost per area cleaned for the “vertical” of manufacturing facilities.

Filters: Type of facility: Manufacturing)
Note: Each building is denoted by a different bar on the chart; buildings in yellow all belong to one company, making it easy for that company to see how its portfolio compares to those of other manufacturing companies.
Provided courtesy of FM BENCHMARKING.
Figure 1 allows you to see at a glance how your facilities compare with other manufacturing facilities. There are 360 buildings in this peer group with a median cost per area cleaned of $1.26 per cleanable SF and a first quartile performance of $1.12 (or less) per cleanable SF.
The yellow bars indicate the facilities for one company in the benchmarked vertical. Note that most of the facilities are in the first quartile with only three facilities in the second quartile. By looking at, and comparing similar types of facilities, you will be able to make intelligent “data driven” decisions. The janitorial contractor for this example had totaled his annual cleaning costs and divided by the cleanable area to determine the annual cost of $1.14, which is in the second quartile. This is an opportunity for the facility managers in the second (or higher) quartile to propose some changes in the service levels or frequencies that would improve the cost performance.
To reach first quartile you could start by reducing your janitorial staff, encouraging the remainder to work faster without reducing the overall quality. However, this usually isn’t too effective. Usually the quality of the services will decline and you will start receiving more complaints.
A much better approach would be to evaluate which best practices other facilities in your organization have implemented to reach the 1st Quartile performance level. Figure 2 shows some of the best practices that have been implemented by the first quartile group. This is only a partial list from FM BENCHMARKING, there are about 30 janitorial best practices overall.
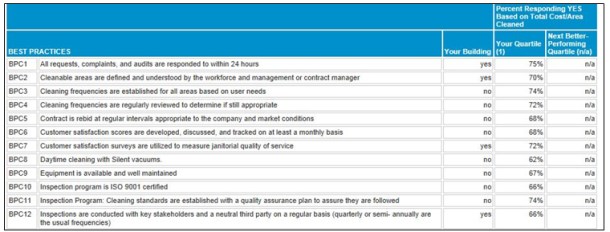
Filters: Primary Use: Manufacturing
Provided courtesy of FM BENCHMARKING.
Using the results from Figure 2, the service provider can make proven recommendations for janitorial services that would help achieve first quartile performance. Again, this is win-win for both the contractor and the owner. The owner will achieve cost savings from the janitorial improvements and improved levels of service; the contractor will improve their profitability by more effectively utilizing their workforce, and there will be improved occupant satisfaction which benefits everyone.