October 2019 — In last month’s article we reviewed how to benchmark janitorial staffing. This month’s article will review how you can benchmark security staffing for either your internal staff or your contractors. Since security costs are primarily comprised of labor, having the right staffing level is the key to a safe and secure facility.
Almost every organization goes through a contract rebid for security services or an analysis of the current costs of providing security services. The specification usually requires the security contractor to provide a staffing plan. Since labor comprises between 80% and 90% of security costs, the vendor with the lowest proposed staffing levels usually has the lowest costs. But the lowest staffing level proposal may not be appropriate for the security of your facilities. Even if you are not in the bidding process, you can use the same benchmarking data to determine if the existing security contractor is adequately staffing for the services required.
Most benchmarking surveys will collect their staffing benchmarks on a full-time equivalent (FTE) annual basis. Depending upon the level of detail, that could ask for:
- Total staff
- Staffing by internal and contract workers
It is our experience that most organizational staffing level questions come down to total staffing levels. In the case of security services, nearly all the staff will be provided by the contractor so in most cases total staff and staffing by contract workers will be the same value. Many organizations may also have some internal staff to handle special investigations and/or manage the security contract so internal staff should also be included in the FTE count. One aspect that you need to look at carefully is how the FTE count is calculated. Many contractors will use part time help. You may have, for example, 10 people in a building for 2 hours each day for 5 days per week at the beginning and end of each shift. The FTE in this example would be calculated at (10 X 2 X 5)/40 = 2.5 FTE
Determining and keeping the appropriate security staffing levels is probably one of the more critical decisions that facility managers and the senior leadership team can make. Don’t be surprised if you get a puzzled look from the security contractor when you ask for the total staffing on your site. Also, don’t hesitate to validate the FTE numbers that are provided. The only way to assure the contractor is living up to their bid is by validating the number of workers on the job.
We have an example from FM BENCHMARKING to illustrate how easy and valuable the process should be and how you can avoid the problem of too many or too few staff. This approach allows you obtain the key output report of staffing per gross area to be kept secure.
Figure 1 shows the cost performance of our building (shown in yellow in the second quartile) compared with other office buildings. We will ignore a few of the extreme responses at both ends of the chart and say the overall performance ranges from about $0.80/GSF to $2.75/GSF. The range for the second and third quartiles is between $1.19 and $1.73/GSF. This is the appropriate cost range to assure the facility is adequately secured.
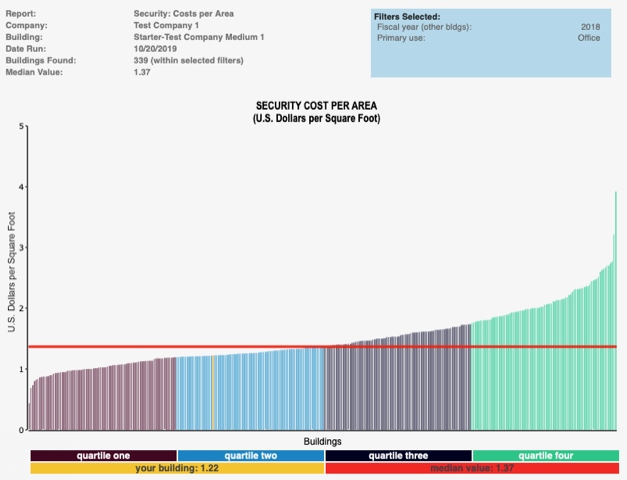
Figure 1 – Security cost per GSF
Filter: Type of facility: office
Provided courtesy of FM BENCHMARKING
Our building shows a value of $1.22/GSF. This would suggest the staffing level is in the right range but let’s look a little further and benchmark the actual staffing levels
Figure 2 shows staffing levels for office facilities. The range for the second and third quartiles is between 16,000 and 12,000 GSF secured per security worker. This is the appropriate cost range to assure the facility is adequately secured. Our position in this chart is in the third quartile at 12,941 GSF secured per security worker.
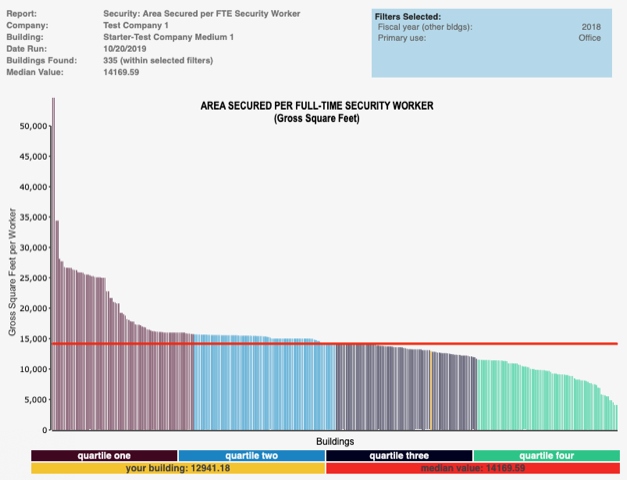
Figure 2 – Area secured per security worker
Filter: Type of facility: office
Provided courtesy of FM BENCHMARKING
Usually the cost and staffing charts have very similar positions. Since our charts are in different quartiles it would make sense to have a discussion with our security contractor and validate that the actual staffing level is consistent with what has been reported.