Many FMs participate in benchmarking programs to see where they stand in comparison to their peers. To obtain good benchmarking results you need comparisons of similar buildings using filters to select the characteristics of the facility you want to compare.
Let’s look at a few examples from FM BENCHMARKING to see the value that filters can bring to the analysis. We will try using different filters to try to determine which ones best define those to which we should compare our building.
In this example our facility is on a “campus setting” (several buildings), a 1,125,000 gross square foot (GSF) facility, 22 years old, with 2,650 FTEs (full-time equivalents), and a primary business function of manufacturing.
The first filter we will turn on is the size of the facility so that we will only consider buildings that are 600,000 GSF or greater and on a campus setting; for comparison purposes, FM BENCHMARKING uses the number of “cleanable” square feet. In the FM BENCHMARKING system this produces 449 facilities for comparison. In Chart I our consumption is shown by the yellow bar with $1.37 per cleanable square foot which indicates a performance in the fourth quartile (green) and considerably above the median value at $1.15 per GSF.

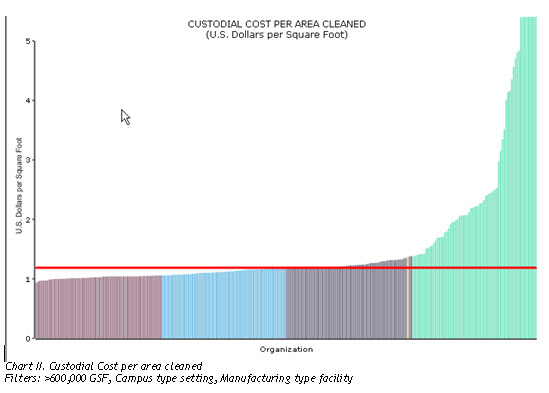
However, just using the size and campus filters are not a good comparison of our building performance. Custodial costs may be impacted by the type of facility, in this case manufacturing. We thus should compare our facility’s performance with that of other peers in the manufacturing industry. When we add the filter:
- Manufacturing
our peer group median performance is more expensive at $1.19 per GSF (see Chart II), even though our own costs have remained the same ($1.37 per GSF). Comparing our performance with other manufacturing type facilities moves our custodial costs from the fourth quartile to the right side of the third quartile.
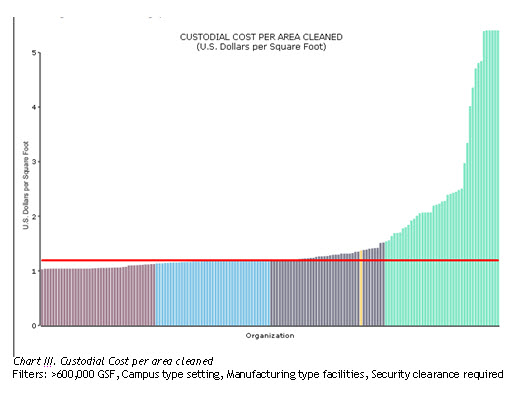
Our manufacturing facility requires a security clearance and background check for all of the custodial staff. Background clearances are expensive and the median cost for our peer group increases to $1.24 per cleanable square foot moving our performance closer to the median (see Chart III).
As you can see, these are significant changes in our ranking position that are made simply by better peer group comparisons from applying filters. Table I below shows the effect of adding filters to our output report.
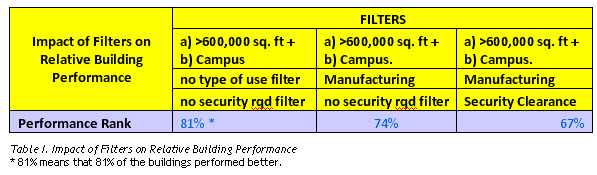
There is quite a difference in the relative rankings. Our facility ranking improved 14% just by thoughtful application of filters. Thus, these filters define our true peer comparison group, which we will us in the best practice analysis that follows.
Now we’ll consider what we can do to improve our building performance further. FM BENCHMARKING provides a very useful tool to integrate best practices responses with the quartile results. In Table II below we answered ‘No’ (i.e., we have not implemented the three best practices shown).
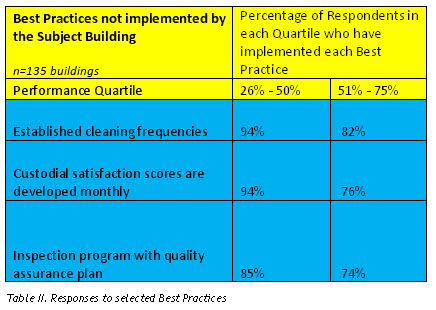
This very valuable feature shows the percent responding “Yes” in our quartile (51% – 75%) and the next better performing quartile (26% – 50%). This makes it very easy to see what actions we might take to improve our performance.