
Do you know your churn rate? The rate almost always shocks FMs and senior managers. We have seen organizations with churn rates between 50 and 75 percent that thought their churn rate was around 10 percent. Quite a disconnect!!!
What is churn? It is the relocation of employees in response to reorganizations, reductions in staff, or transfers. Managing churn efficiently is an essential success item for virtually any FM.
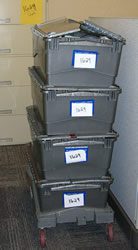
The tools to manage churn are evolving too. For example, at IFMA’s World Workplace show, there were many exhibitors of companies who make or rent plastic moving crates and rolling carts, and move scheduling software was also in abundance.
Here are the critical benchmarking questions to measure how effectively your organization supports churn activity.
Step 1 — Churn Benchmarking Definitions
Office Relocations covers moving people in an office environment and office-to-office “box” moves. Those moves involving only the relocation of an employee’s belongings but no changes to furniture or partitions other than minor ergonomic assessments and adjustments e.g. keyboard, work surface height.
| Internal Costs ($000) | Contractual Costs ($000) | |
| 1. Office personnel relocation – Moving Cost – report the total cost for moving the employee’s belongings from one location to another including packing materials and transportation. Do not include the employee labor required for packing. | ||
| 2. IT Support – includes the cost of moving and setting up an employee’s information technology equipment. e.g. computer, printer. Exclude any PC change outs / moves that are related to lease terms and / or product upgrades. | ||
| 3. Telecommunications Support – includes the cost of moving and setting up an employee’s voice / phone equipment. | ||
| 4. Indicate the total number of people moved associated with the expense shown above in 1 – 3. | ||
FTE (full time equivalent) Move Support Workers…
| Employees | Contractors | |
| 5. Indicate the number of FTE (full time equivalent) Office personnel workers associated with the expense shown above in L1. | ||
| 6. Indicate the number of FTE (full time equivalent) IT Support workers associated with the expense shown above in 2. | ||
| L7. Indicate the number of FTE (full time equivalent) Telecommunications Support workers associated with the expense shown above in L3. |
Step 2 — How Do I Compare With Others
First of all, many organizations believe their churn rate is too high. Facility Mangers can not stop churn — at least not for long. The median churn rate for Corporate America continues to rise. This year’s median churn rate was 45 percent, but note that some organizations have an annual churn rate in excess of 200 percent, and about a third of the group has an annual churn rate in excess of 100 percent. That means that, for a third of the participants, everyone moves every year. If your churn rate is on the low end, then there is a good chance that some moves are taking place without your knowledge.
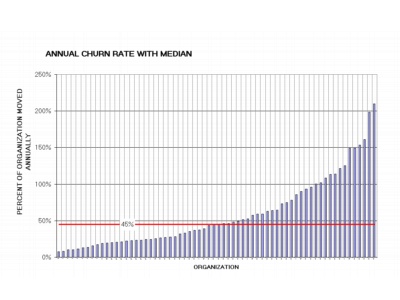
Once this information is collected it is easy to normalize the data on a unit cost basis to determine how efficiently the move process is being handled. One of the churn charts in the Facility Managers Roundtable Group would look like this

Of noteworthy interest is how consistent the cost structure looks for participants below the median value. There are 17 sites that perform the churn activity — including IT, Phones, and Physical Move – at a cost of between $150 and $275 per person. What can we learn from these results
- First, this is an excellent indicator that the questions are understood by a signification portion of the group.
- The data is collected in a manner that is consistent in the way the question is written.
- It is highly likely that we will find some Churn Activity Best Practices in this group. In fact, since this group has been benchmarking together and their costs are consistent we can expect that some of the sites have already adopted some of the best practices.
Step 3 – Using This Information
You’ve completed your churn data collection and performed the calculations. Here are a few questions you should ask yourself
Step 4 — Some Best Practices
The Churn process is one of the issues we discuss every year at our best practices meeting. Some best practices include
- Support small group moves (under 10 persons) on a weekly or bi-weekly basis.
- Support larger group moves as a project
- Facilities leads a weekly coordination meeting with IT and Telecommunications.
- Use crates instead of cardboard boxes — they are easier to move, and there is no waste (a greener process that you will provide LEED points.
- Limit the number of crates that you will move (top performing organization limit the number to 3 or 4).
- Charge back for the crates if they are not returned in the specified time (usually three or four days after the move).
- Provide opportunities for file clean-out before the move. Some organizations host a pizza / file clean-out party to improve the participation.
- Eliminate the boxes or crates with rolling carts

Facility Managers Round Table (FMRT)
In 2008 there were 82 unique sites in the FMRT with a median size of about 1,380,000 million square feet.
For more information, contact Facility Issues through their Web site, via e-mail to Keith McClanahan, or via phone at 928.213.9767.