January 2016 — In last month’s article we looked at benchmarking indicators that would show when it is time to rebid the janitorial contract. FMs are almost always under pressure to find better ways to clean; to provide a better, healthier environment for the occupants; and to cut costs. Too often, it seems that janitorial services are often the first things to be cut and it’s very difficult to get the funds back when the economy improves. Many FMs readily admit that their facilities are “somewhat dirty” and would like to do something to improve the appearance and cleanliness of their facilities.
Janitorial benchmarking, as we discussed last month, can help you understand how your costs compare with others in your peer group and may be able to help you justify additional budget funds.
Most FMs are familiar with benchmarking concepts. You enter your cost data, occupancy, and areas. From this data, a good benchmarking system should be able to provide a normalized cost comparison. This kind of benchmarking system shows where you stand compared to your peers as in the example below shown in Figure 1. This chart allows you to see at a glance how well your facility is performing its janitorial functions. There are 337 buildings in this peer group with a median janitorial cost per GSF of $1.34 per Cleanable SF and a first quartile performance of 1.21 per Cleanable SF. Our facility is in the middle of the second quartile and shown in yellow. It is operating at $1.27 per Cleanable SF.
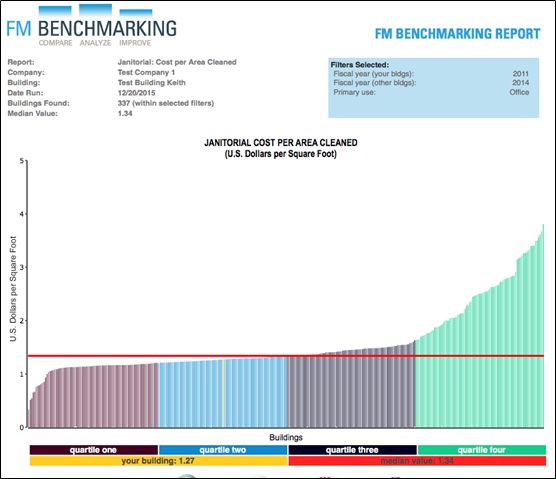
Figure 1 – Janitorial Cost per Cleanable Area
Filters: Office Facilities
Provided courtesy of FM BENCHMARKING (www.fmbenchmarking.com)
Any benchmarking tool should be able to provide this type of report. And, any facilities manager looking at this chart should be asking the question, “What do I do to get better or reduce the level of complaints?” Based on the cost performance, compared with the peer group, it doesn’t look like there is a funding problem.
A good benchmarking tool will provide you with the information to answer that question. Figure 2 identifies the first six best practices from the FM BENCHMARKING application for janitorial services for the same group of buildings used in Figure 1 above.

Figure 2 – Janitorial Best Practices (partial list)
Filters: Office Facilities
Provided courtesy of FM BENCHMARKING (www.fmbenchmarking.com)
To improve your janitorial performance and reduce the level of complaints, you need to know what to change in your facility. A way to do that is to compare what others are doing with best practices. Note that for the first six best practices, we have not applied any of them in our facility (the “Your Building” column is blank). Note also the percentages that have been applied by our peer group in our quartile (2nd quartile) and the next better performing quartile (1st quartile). The first two do not have sufficient data but the next four do. Note the higher implementation rates for rows JB03-JB06. Implementation rates range from 6% to 14% higher in the next better performing quartile. Using the best practices tables would be a good way to improve the overall quality of the service delivery. Using this best practices module we could carefully analyze which best practices would have the highest benefit to improving janitorial services. By applying these, you are sure to improve your performance.