Can you easily show your performance trends? Did you know that data entered in a benchmarking system can be used to document your janitorial improvements? This is a really straightforward process that shows the importance of the FM position in the organization.
Without good benchmarking comparisons you may not realize that janitorial costs can be reduced, your level of service is too low, or which best practices may have the most impact on improving your janitorial operations. As you can see, a case can be easily made for benchmarking that will justify the minor amount of staff time.
We have used real-world examples from clients to illustrate how easy the process should be. This approach allows you to obtain the key output reports in the minimum amount of time.
In the following example we benchmarked janitorial performance and noted which “best practices” had been implemented in 2010 (we then will see below the improvement made in 2011). These benchmarking results showed areas for improvement justify productivity improvements that improve the performance of the portfolio.
Focus on the KPI (Key Performance Indicators) for the janitorial metrics that need to be benchmarked:
- Janitorial Cost per Area
- Janitorial Best Practices
The process is really straightforward:
- Look at our benchmarked janitorial costs for FY 2010.
- Look at which best practices we have implemented and could implement in 2011.
- Implement the recommended best practices in 2011.
- Review 2011 benchmarked costs to see how the implemented best practices affected our performance.
Figure 1 shows our janitorial performance compared with our peer group of other office facilities in 2011. This allows you to see at a glance how our facility compares with other office buildings. There are 225 buildings in this peer group with a median janitorial cost of $1.19 per square foot. Our building is in the middle of the fourth quartile with a janitorial cost of $2.28 per GSF. This is not very good performance, but there is ample room for improvement. By looking benchmarking data in this way and comparing similar types of facilities, you will be able to make intelligent “data driven” decisions.

Filters: Type of facility (Manufacturing and greater than 600,000 GSF)
Let’s look at the best practices we subsequently have implemented and see what others have implemented so we can generate some ideas that would improve our performance. We will use the cost performance data to see what others in our quartile and the next better performing quartile have done. So we not only are benchmarking our costs, but also our best practices—a key point when trying to improve one’s building performance.
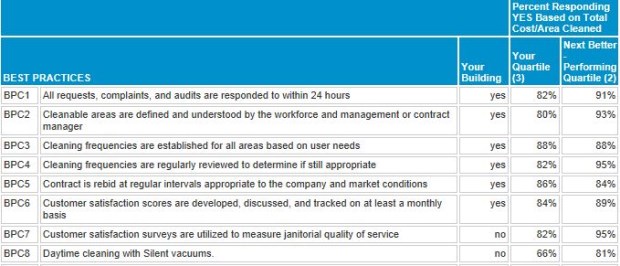
Figure 2 is a listing of some best practices implemented by those participants in our quartile and the next better performing quartile. There actually are more than 20 best practices in the full table. After looking at just the first few we might consider recommending:
- BPC4 — Cleaning frequencies are regularly reviewed to determine if still appropriate. This is a practice that obviously has a significant impact on the costs and levels of service. Note that there is a significant jump in the implementation rate from the 4th (58%) to the 3rd (84%) quartile; in other words, many more people in the 3rd performance quartile reviewed their cleaning frequencies than those in the 4th quartile.
- BPC5 — Contract is rebid at regular intervals appropriate to the company and market conditions. This also would seem like a logical program to implement since the costs of service will increase over time without competitive market pressures.
- BPC6 — Customer satisfaction scores are developed, discussed, and tracked on at least a monthly basis. There is a significant jump of 13% in the implementation rate from the 4th to 3rd quartile which again suggests that there is a high correlation between the levels of service and measured customer performance scores.

Filters: Type of facility (Manufacturing and greater than 600,000 GSF)
So by looking at the more than 20 best practices we can easily develop a program of top priority items that will reduce our janitorial costs and improve the janitorial quality. This gives us an excellent idea of the types of programs to implement in fiscal year 2011.
Management approved the funding for our recommend projects in early 2011. The programs were implemented and we benchmarked our performance again in early 2012 for the calendar year ending 2011.
Figure 3 compares our janitorial performance to other office facilities in the same manner as Figure 1 except that this is for 2011. Note that we are now in the 3rd quartile and our janitorial costs have declined to $1.36 per GSF. This is a reduction of $0.92 per GSF over the entire building—quite an improvement. There are 225 buildings in this peer group with a median janitorial cost of $1.23 per GSF so this is a very similar peer group compared to our 2010 benchmark, just one year later.

Filters: Type of facility (Manufacturing and greater than 600,000 GSF)
Not only can we show significant improvement, but we have documented our initiatives in the “janitorial best practices.” Note that in 2011 we implemented:
- BPC4 — Cleaning frequencies are regularly reviewed to determine if still appropriate.
- BPC5 — Contract is rebid at regular intervals appropriate to the company and market conditions.
- BPC6 — Customer satisfaction scores are developed, discussed, and tracked on at least a monthly basis.
In Figure 4, we see that the benchmarking data supports our decision to implement these best practices and the implementation rates are even higher for the 2nd quartile. This means a higher percentage of our peer group has also implemented these best practices. We are in good company with steadily improving performance.
Filters: Type of facility (Office)
Conclusions
Using the results from benchmarking, the FM can make proven recommendations to reduce janitorial costs and improve janitorial performance. The company achieved:
- Janitorial cost savings by implementing the best practices recommendations.
- A better performing janitorial workforce.
- Improved levels of service or no degradation of service.