Utility costs seem to always be on facilities managers’ hot topics lists or top issues. When you look at the overall spending pie chart, for almost any facility, it’s easy to understand why. Utility costs usually represent the largest single expense of any operating budget and are usually in the 30 to 35% range of total operating costs. FMs who are looking to improve their budget performance by reducing utility costs are focusing on the right area.
At almost any benchmarking conference or forum that I attend it seems that someone always asked the question, “Is there a way that benchmarking can be used to help reduce my utility expenses?” Well the short answer is, “Yes, you can!” Benchmarking can help with that.
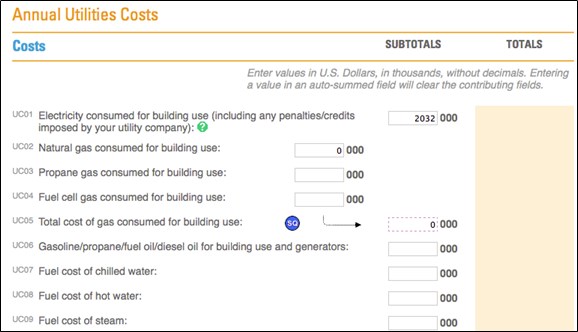
Most FMs are familiar with benchmarking concepts. You enter your cost data, occupancy, and area calculations.
From this data any benchmarking system should be able to provide a normalized cost comparison of your utilities costs. This kind of benchmarking system shows where you stand compare to your peers as in the example below. Figure 2 is filtered for the gross area to show all buildings greater than 600,000 sq. ft. and the type of facility (office). Note that our building is in the low end of the second quartile with a utilities cost of $1.88 per square foot. There is some room for improvement and it’s probably going to take the implementation of some key best practices to move into the first quartile.
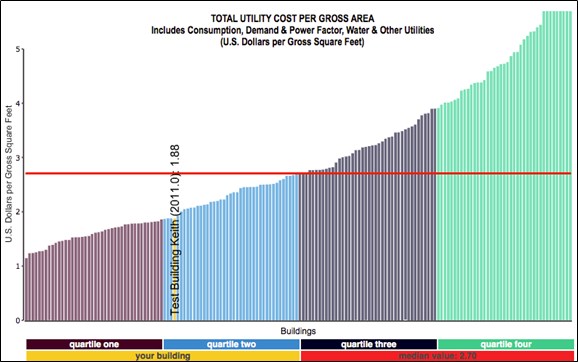
Again, most benchmarking tools should be able to provide this type of report. And, any facility manager looking at this chart should be asking the question, “What do I do to get better, or move into the first quartile?”
A good benchmarking tool will provide you with the information to answer that question. In Figure 3, we see the first five best practices identified by a benchmarking tool. Note, question UB05 is new and there’s insufficient data in the system—a good benchmarking tool must stay current with the latest trends.
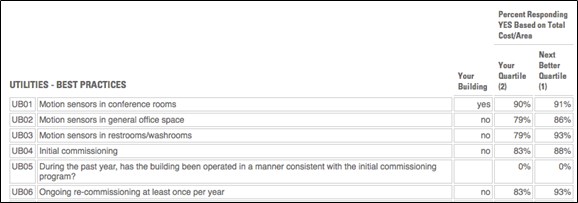
To improve your performance you need to know what to change in your facility. A way to do that is to compare what others are doing. Note in Figure 3 that most of the best practices shown and implemented by the participants in our quartile and the next better quartile have not been implemented at our facility. FM’s should carefully analyze which best practices would have the highest return on investment and the highest benefit reducing utility costs. By applying these, you are sure to improve your performance. For a little bit of your time you will receive quite a bit of valuable feedback on which best practices would have the most benefit to improving your performance.