June 2016 — FMs typically receive complaints about the quality of cleaning in their facilities. No matter the level of service provided, some complaints are inevitable just because occupants have varying expectation levels. However, there are ways to improve the service and reduce the number of complaints to a reasonable amount.
First, have a good service level standard and be sure the janitorial contractor understands what is expected. Does the standard require the restrooms to be cleaned three times per day? Is trash emptied daily? Are office carpets vacuumed weekly? Set standards that are appropriate to your functional needs and the occupancy levels in the facility.
Second, verify that the standards are being followed. Janitorial contractors have indicated in informal discussions that much of their profit is obtained by not performing the work called for in the specification. From observation, we think it is common industries practice to under-staff the custodial workforce after a certain period.
Third, verify that your staffing levels are appropriate with a benchmarking tool. You will need two data points to complete this task:
- Total area cleaned
- Number of FTE janitorial staff that are actually on the job
We used FM BENCHMARKING’s Query Edition to obtain the benchmarking comparisons show in the graph below. Two filters have been applied
- Gross area: 250,000 – 599,999 GSF
- Type of facility: Office
These filters provide 78 buildings for comparison (see Figure 1). There actually are over 60 such filters that are available, but we select only two.

Figure 1 –Query Edition Filters: Gross Area & Primary Use
Provided courtesy of FM BENCHMARKING.
Figure 2 shows that first (best-performing) quartile janitorial staffing levels are at about 25,000 GSF cleaned per worker. The median value (horizontal red line) is about 20,000 GSF cleaned per worker.
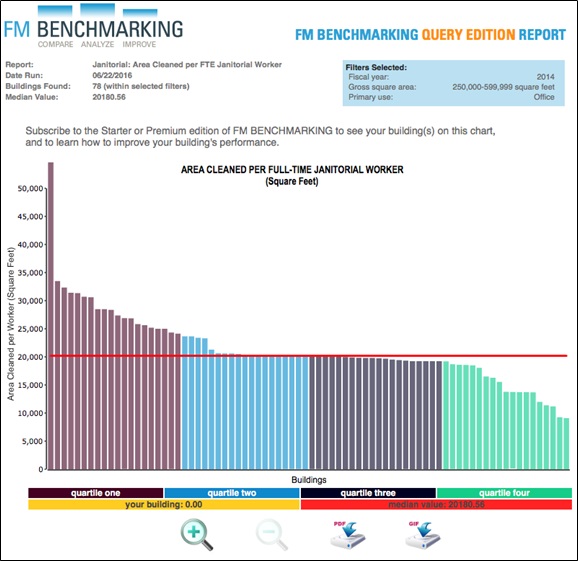
Figure 2 –Area Cleaned per FTE Janitorial Worker
Filters: Gross Area & Primary Use
Provided courtesy of FM BENCHMARKING.
Now you should verify what level of janitorial staffing you have using the FTE count and area cleaned for your facility. If it is significantly higher or lower then take additional actions to bring the staffing level back into the appropriate range.
Again, most benchmarking tools should be able to provide this type of report. And, any facilities manager looking at this chart should be asking the question, “What do I do to get better, or move into a lower (better-performing) quartile?”
One way to do this is through benchmarking best practices, where one can see which best practices are being performed by the buildings in lower quartiles, and then compare them to your own. Some benchmarking tools also enable these types of comparisons.