December 2018 — FM portfolios have generally grown this past year (2018). In some cases, growth comes from mergers and acquisitions. For others, the business has grown with the subsequent need for more facilities. Or in other cases, there are customer service or IT initiatives that need more space.
With growth comes the realization that some facilities may be operating less efficiently than others. Organizations with more than a few properties in their portfolio can use benchmarking to their benefit in a number of ways. The easiest way to start is to benchmark facilities of similar types. These types of facilities can be:
- Headquarters or Class A office space
- Courthouses
- Jails
- Parking structures
- Retail branch banks
- Data centers
- Call centers
- Healthcare: hospitals, physician’s offices, etc.
- Back office facilities
- Malls
- Retail: grocery, pharmacy, big box, etc.
Reasons for large companies to benchmark
Most large companies would have facility portfolios containing multiple, similar type, facilities that could be benchmarked so the performance can be compared. If you need a little more info to get started, here are some of the reasons large organizations benchmark their portfolio:
- Facilities with low cost-operating profiles can share their best practices across the organization so the entire organization benefit. There are no confidentiality issues in this situation internal to the company, so the information can be freely shared without any concerns about the data and/or “lessons learned” falling into competitors’ hands. This also is an effective way to break down barriers to communication across the organization.
- Good data are needed to show which facilities are operating in an efficient manner. Facility costs are the second largest component of production costs, after labor. This information was recently used by a large utility to shrink the size of one call center and increase the size of another. Benchmarking information is a key element of this process.
- FMs of individual properties or groups of properties in the portfolio are under continuing cost pressure and are always looking to control costs and reduce operating expenses. Benchmarking data can support their cost position. For example, if you already are in the low 1st quartile cost profile (lowest costs), and already are providing good quality services, you can explain this to the management team and mitigate some of the pressure to reduce costs. If your costs are high then you should begin thinking of ways your peers have reduced them while still maintaining profitability.
- Many large organizations benchmark their costs across the portfolio but run comparisons on similar types of facilities. For most organizations it is common to benchmark administrative facilities, production facilities, data centers, call centers, and distribution centers as common types of facilities. All large organizations have more than one of these types of facilities so benchmarking comparisons between these facilities are meaningful.
Common “excuses” not to benchmark
There usually is no shortage of reasons why this type of benchmarking exercise doesn’t get started…
- Everyone is busy, often doing more than one job, and the press of daily issues and problems often keeps the benchmarking initiative from beginning or progressing.
- Often the resources to provide benchmarking data reside in different parts of the organization. We recently worked with an organization that had call centers for each business unit and the FMs reported to the business unit. It took some time to get that project started.
- Data may be held by different organizations. Some information regarding space, headcounts, utility consumption, utility billings, etc. may not be readily available.
- Many benchmarking forms are frequently not user friendly so no one usually volunteers to “benchmark” unless they can see the benefits.
- The task of benchmarking often looks formidable until you start. Once you begin, it really isn’t that tough.
All of these issues can be easily overcome and the benefits to benchmarking certainly outweigh the negatives. Without good benchmarking comparisons, organizations may not realize which facilities have a high or low-cost profile.
It also is interesting to note that the 80-20 rule applied to benchmarking. One usually will get 80% of the benefit from benchmarking by comparing just 20% of the data. What this means is that the concerns about time to collect data are less likely to be valid—they should not prevent you from starting to benchmark.
Where to start benchmarking?
Here is a suggested approach to help you to get started. We have used examples from FM BENCHMARKING to illustrate how easy the process should be and this approach will allow you obtain the key output reports in the minimum amount of time.
First of all, benchmarking can be an intensive effort so focus on what is most important! A quick review of your budget will show that:
- Energy and utilities
- Maintenance
- Janitorial services and
- Security
usually represent the largest share of your operating expenses. These four components typically represent, for most facilities, between 95 and 97 percent of your controllable operating expenses. The largest expense of these four is almost always the energy and utilities budget, closely followed by maintenance. If energy and utilities haven’t been carefully benchmarked in the past year or so it is also one with the highest potential for savings.
Utilities can be benchmarked on a cost basis: Utilities cost/Area or on the basis of energy intensity (either the kWh/Area or BTU/Area). In this example we will compare a large manufacturing organization on its cost performance. However, comparing utility costs may give you the wrong perspective on your performance, unless the comparisons are made with a relevant peer group. In this example we will use:
- Manufacturing facilities (that is what our subject company is)
- Large: greater than 600,000 SF (our company has a large facility)
- Operating continuously (24 hours X 7 days per week)
Here, is a chart showing the energy costs using the above criteria.
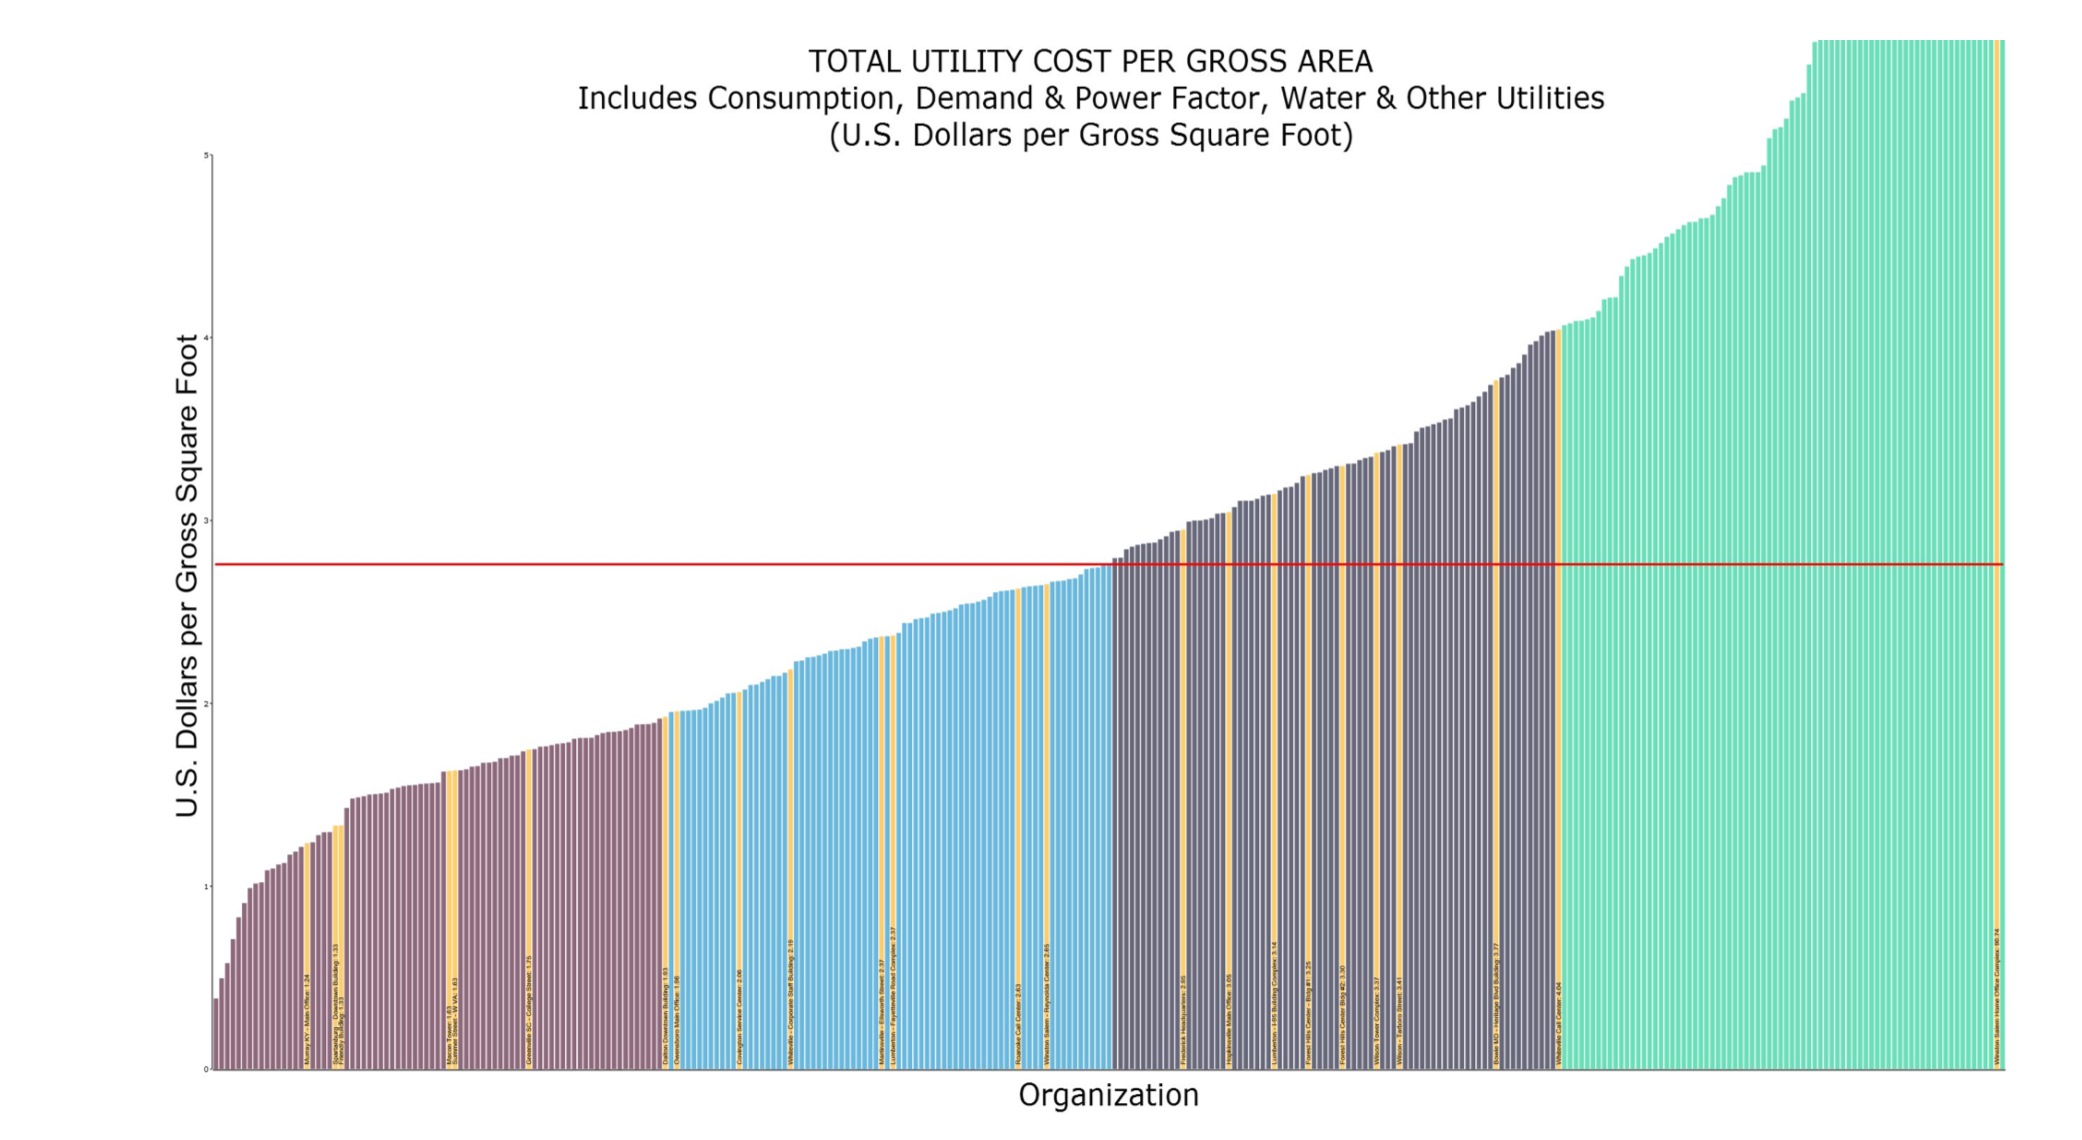
Figure 1 – Utility Cost per Area
Filters: Type of facility (Manufacturing, continuous operation, >600,000 GSF)
Provided courtesy of FM BENCHMARKING.
Figure 1 allows you to see at a glance how your facilities compare with other manufacturing buildings. There are 315 buildings in this peer group with a median utility cost per square foot of $2.76 and a first quartile performance of $1.88 per square foot.
The yellow bars indicate the manufacturing facilities in the benchmarked organization, as it has multiple manufacturing facilities. Note that most of the facilities are in the first and second quartile, but there are eight facilities in the third quartile with one facility in the fourth quartile. By looking at and comparing similar types of facilities, you will be able to make intelligent “data driven” decisions that can improve the performance for all the benchmarked facilities. Part of the analysis should be studying the energy best practices that are employed at the better-performing facilities, and then comparing them to those in the 3rd and 4th performance quartiles.