Many organizations are on a fiscal year that coincides with the calendar year. If so, now is the time when you are asked to submit your annual budget request.
There are a number of ways this can be accomplished:
- Many organizations look at their budget and spend for the current year and submit a request based on the current year with a percentage increase.
- Other FMs use a zero-base budget approach and construct the next year’s budget by reviewing system needs, staffing levels, contracts, leases, insurance, and any other major known expenses. A prudent FM will also submit some value for contingencies or spread a contingent amount over all the budget line items.
- There is also a budget development approach that utilizes benchmarking values as the basis for the upcoming year. FMs will run benchmarking reports for all the major cost components showing the current performance and through discussions with the FM team, set budget goals based on benchmarking improvements.
Using benchmarking to set budgets has several advantages:
- You can show in an objective, analytical way the budget targets.
- Others can readily understand the approach.
- The performance can be measured throughout the year to show how the organization is performing.
For this approach to work, you need at least three key metrics (KPIs) or four, if security is part of your functional responsibility. We are talking about financial budgets here so all your KPIs need to be normalized in cost per area.
Which brings up another point that is often overlooked by FMs. If space is added or removed from the portfolio during the year, your budget needs to change. You shouldn’t be expected to “make do” with an existing annual budget when space is added and you should be willing to reduce your budget if space is reduced.
Start preparing your budget with utility costs
The first KPI we should target, and usually the most significant portion of an FMs budget, is utility costs. In Figure 1 below you can see our facility’s utility cost per gross square foot shown in yellow and near the middle of the third quartile. Let’s set a meaningful budget target of reaching the median performance level of $3.84 per gross square foot over a three-year period. To do that, we will need to reduce our costs about $0.24 per gross square foot over each year. That shouldn’t be too difficult since the benchmarking approach to budgeting also identifies best practices that can be implemented. By the way, that is only about a 5% budget reduction from current performance on an annualized basis.
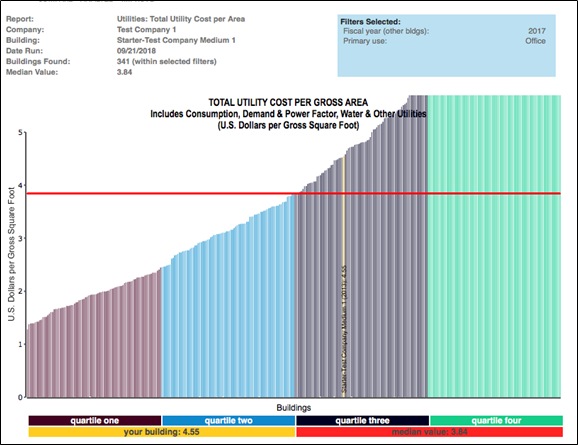
Figure 1 – Total utility cost per GSF
Filters: Type of facility (Office)
Provided courtesy of FM BENCHMARKING
Maintenance costs are a second key part of budget prep
Let’s consider our next most critical KPI in the budget performance, Maintenance. In Figure 2 below you can see that our maintenance performance matches up with the median performance of our peer group.
Let’s set a budget reduction goal of a modest 2% per year for the next three-years. That is only $0.05 per gross square foot and well within the budgeting tolerance of any group. Again, the benchmarking best practices that have been discussed in previous articles will show how this can easily be achieved.
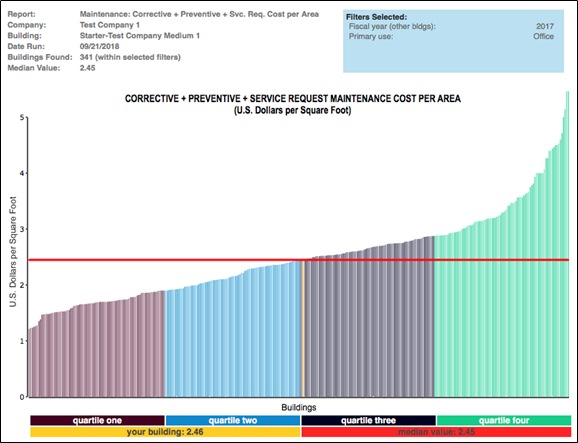
Figure 2 – Total maintenance cost per GSF
Filters: Type of facility (Office)
Provided courtesy of FM BENCHMARKING
The third component of one’s budget prep is janitorial costs
Although much less than utilities and maintenance costs, janitorial costs can consume one sixth of the budget
Finally, let’s consider our janitorial KPIs. They are usually the third most significant component of any FMs budget. In reviewing Figure 3 below, it is clear we have a problem. Fourth quartile performance is not an acceptable position.
The approach here should be to review this chart with janitorial services provider and identify contract changes that would make steady improvement to the median. If the provider is unwilling to enter into discussions to resolve this issue it is time to rebid the work.

Figure 3 – Total janitorial cost per area cleaned
Filters: Type of facility (Office)
Provided courtesy of FM BENCHMARKING
Clearly this is an effective way to develop budgets that would provide successful results to improve performance.