April 2020 — Maintenance costs are normally the first or second largest cost for most FMs. As organizations struggle to deal with the impact of COVID-19 you can be sure that maintenance costs will be looked at carefully this year.
Many FMs will probably be called upon to find options that would improve the efficiency of their maintenance organization and cut costs. Many FMs participate in benchmarking programs only to find that they have difficulty developing good comparisons for their facility type. Having access to ample data with good filter sets is key to making the right comparisons. Here are a few examples to show the value that appropriate filters can add to the analysis of your benchmarking data.
First, we will filter for the type of facility for our subject building: Office. It makes no sense to include other types of facilities such as manufacturing, education, healthcare or research as their cost profiles are very different.
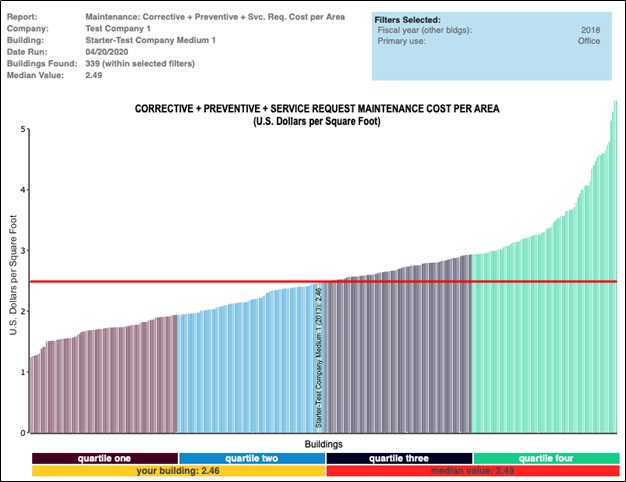
Figure 1 – Maintenance Cost per GSF
Filters: Type of facility: Office.
Provided courtesy of FM BENCHMARKING
In Figure 1, our building is shown in yellow, near the median, with a maintenance cost of $2.46 per GSF (gross square foot).
Then, in addition, we want to see how the size of a facility impacts maintenance costs. Our building is about 220,000 GSF; we believe that larger or smaller facilities may have a scale factor that results in lower costs so we may want to look at just facilities that are in our size range. In this case, we will look at facilities between 125,000 and 250,000 GSF, as shown in Figure 2.

Figure 2 – Maintenance Cost per GSF
Filters: Type of facility: Office; Size: 125,000 – 250,000 GSF
Provided courtesy of FM BENCHMARKING
Buildings in this size category have more efficient maintenance costs than those less than $125,000 GSF. Note that the median has dropped from $2.49 / GSF for all office facilities to $1.95 for office facilities in the size range of our facility. Instead of being at the median in maintenance costs our facility is now in the fourth quartile, which is not very good from a performance perspective.
What other factors might significantly impact the cost of maintenance operations to ensure that we are making the appropriate comparisons? Possibly the number of shifts that the facility operates may have an impact? There is a lot going on at our facility and it operates for 16 shifts per week. We would expect buildings that operate this much per week to have higher maintenance costs than those that do not.
In Figure 3, we will filter for the range of 8-16 shifts and see how the facility compares with this peer group; thus, we are taking out the facilities that operate only 5 days a week. We removed the office size filter so we could see the impact of just the number of shifts.

Figure 3 – Maintenance Cost per GSF
Filters: Type of facility: Office; Shifts per week: 8 – 16
Provided courtesy of FM BENCHMARKING
Note that the median cost, with the shift-filtered sample, is $2.35 / GSF, which is a higher than the previous filtered example in Figure 2, but slightly lower than the example in Figure 1.
Conclusions
Some things we’ve learned from applying various filters in our example that may affect management focus:
- Our costs are in the high range for filtered peer groups
- The multi-shift filter is a good one to use since the facility is operating continuously during the week.
- Some additional analysis should be done to determine why our costs do not compare well with similar sized facilities.
- We should examine the maintenance functions provided and determine what is contributing to the high cost profile.
- We also should compare the best practices being done in our facility to those being done in the better-performing facilities, to see if these give us an idea of what we can do to improve our performance.
As you can see filters are powerful tools to enhance your benchmarking value. By applying filters, that are appropriate to the benchmarking metrics under consideration, you can enhance the value of the process.