August 2018 – This article is the fourth in a series showing how best practices tools can be used to improve security performance. By benchmarking the security performance and applying specific filters you will see which security best practices have the most impact. You will also minimize the time spent on practices that have minimal or no payback.
Other articles in this series include:
Figure 1 shows that the security cost for our facility is $1.22 per square foot and the median value is $1.31 per square foot. Our building’s cost is shown in yellow and is in the blue second quartile (it also is labeled). While the performance is OK, clearly there is room for some improvement and senior management has asked for cost reductions.
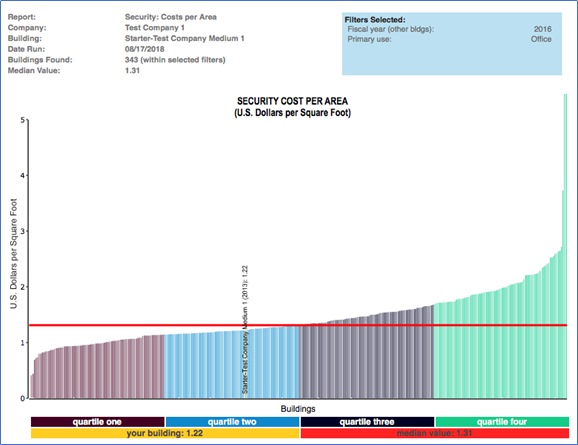
Figure 1 – Total security cost per GSF
Filters: Type of facility (Office)
Provided courtesy of FM BENCHMARKING
A normal reaction would be to just reduce security staff hours or present a case to management that nothing further can be done. But a better approach would be to evaluate our practices analytically to see if there is some type of improvement that would reduce costs and not impact the quality of security services. This is where benchmarking of best practices can lead us to make good decisions on which programs would have the most impact.
Consider Figure 2 below. This shows the percent of Security Best Practices implemented by the peers in our building’s quartile (2) compared to the percent implemented by the next better quartile (1).
Figure 2 – Security Best Practices (partial list)
Filters: Type of facility (Office)
Provided courtesy of FM BENCHMARKING
Our first observation is that the facilities team has already focused on some of the critical best practices such as (these are shown as “yes” in the column called Your Building):
- SB01 – All employees wear identification badges
- SB03 – Certification: Between 80% and 40% of the guard force is certified by the state, ASIS, or an equivalent authority
But there is another key best practice that has not been implemented:
- SB05 – Internal audit reviews are conducted at least annually to assure data accuracy
This best practice has an 8-point percentage spread between the first and second quartiles and may significantly identify issues that are overlooked in the performance of security services.
Only five security best practices have been discussed here. There are 16 security best practices in the full chart. Clearly this is an effective way to identify options that would provide successful results to improve performance.