November 2018 — Change in your facility portfolio is inevitable, and many organizations are expanding or consolidating smaller facilities into larger ones. Although benchmarking tools may not be the usual place FMs look to help develop budgets before these facilities are occupied, they can be used very effectively for this purpose. If you are trying to justify or modify your budget to include portfolio changes, benchmarking can help.
First, let’s look at some other budgeting approaches and see why benchmarking for budgets with portfolio changes is a better option:
- We can base our budget forecast on our current operating costs. This approach isn’t very effective since it doesn’t take into account the age or use of the proposed facility—rather, it looks at data based on the current facility.
- You can use the A/E’s estimate of operating costs for the new/remodeled facility. This may not be very accurate since A/Es don’t usually have a good background in these types of costs.
- Don’t ask for any budget adjustments and request a variance as the facility comes on-line. This is not a very good approach since your budget starts from zero and everyone knows that costs can’t be zero.
Using benchmarking to set budget levels has several advantages:
- You can show in an objective, analytical way, comparisons with other organizations. This type of data is very supportable and difficult to argue against.
- Senior management and the finance or budget group can readily understand the approach.
- The performance, using actual costs, can be measured on a monthly basis to show the accuracy of your benchmarking budget approach.
For this approach to work, you need at least three key performance indicators (KPIs) or four, if security is part of your functional responsibility. We are using budget-level values so all factors would be shown based on the size of facility:
- Utility Cost/Gross Area
- Maintenance Cost/Gross Area
- Janitorial Cost/Area Cleaned
- Security Cost/Gross Area
By utilizing benchmarking values for these four KPIs, which typically represent about 85 percent of O&M costs, we can factor up to obtain the benchmarked value for total operating costs of the new or remodeled facility. Clearly this is an effective way to develop budgets in an analytical way.
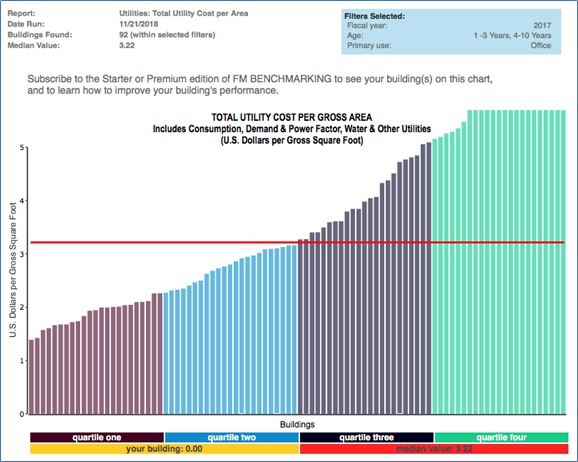
Figure 1 – Total Utility Cost per Gross Area
Filters: Type of facility (Office); Facility Age (1-10 years)
Provided courtesy of FM BENCHMARKING
In Figure 1 above you can see that the median utility cost for office facilities that are less than 10 years old is $3.22 per Gross Square Foot. We can easily develop three of four more charts that show the median costs for maintenance, janitorial, and security operations for similar types of facilities. This can be used to develop a budget estimate that is analytical and fact based.