by Brianna Crandall — July 27, 2016 — The Building Owners and Managers Association (BOMA) International, in collaboration with research firm Kingsley Associates, just released its 2016 Office Experience Exchange Report (Office EER) and the 2016 Industrial Experience Exchange Report (Industrial EER). Data from these interactive online benchmarking reports offer critical insight into income and expenses within the commercial real estate industry.
Property professionals use the annual EER data to benchmark operating expenses and identify key industry trends as part of their asset management strategies used to drive profitability, increase tenant satisfaction and stay competitive.
Office EER
Now in its 96th year, the Office EER offers comprehensive benchmarking for the office sector, with information from more than 5,200 buildings in 272 distinct markets across the United States and Canada totaling nearly 900 million square feet of space.
Top-level U.S. private-sector data from the 2016 Office EER reveals:
U.S. Private-Sector Office Building Occupancy Figures
- Average occupancy rate: 89.88 percent
- Square feet per office tenant: 7,746.08
- Square feet per office worker: 309.74
U.S. Private-Sector Office Building Income Figures
- Total rental income: $26.62 per square foot (psf)
- Total income: $28.21 psf
- Base office rent: $21.98 psf
- Pass-throughs: $4.73 psf
- Escalations: $4.85 psf
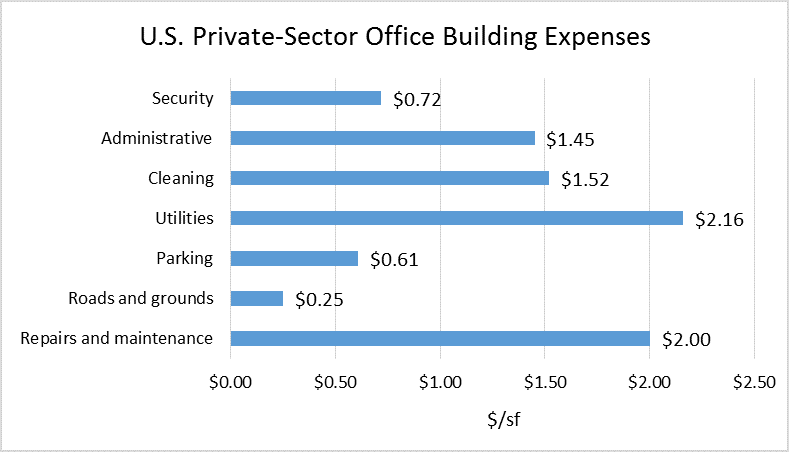
U.S. Private-Sector Office Building Expense Figures
- Total operating expenses: $8.07 psf
- Total operating + fixed expenses: $12.47 psf
- Security: $0.72 psf
- Administrative: $1.45 psf
- Cleaning: $1.52 psf
- Utilities: $2.16 psf
- Parking: $0.61 psf
- Roads and grounds: $0.25 psf
- Repairs and maintenance: $2.00 psf
 Industrial EER
The Industrial EER, now in its second year, is specifically tailored to the industrial sector. This year’s edition offers industrial sector data from approximately 3,900 buildings in 102 distinct markets in the United States totaling more than 645 million square feet of space.
Top-level U.S. private-sector data from the 2016 Industrial EER shows:
U.S. Private-Sector Industrial Building Occupancy Figures
- Average occupancy rate: 96.61 percent
- Square feet per tenant: 65,609.10
- Square feet per tenant employee: 527.28
U.S. Private-Sector Industrial Building Income Figures
- Total rental income: $5.35 psf
- Base rent: $4.31 psf
- Additional rent: $1.21 psf
- Miscellaneous income: $0.07 psf
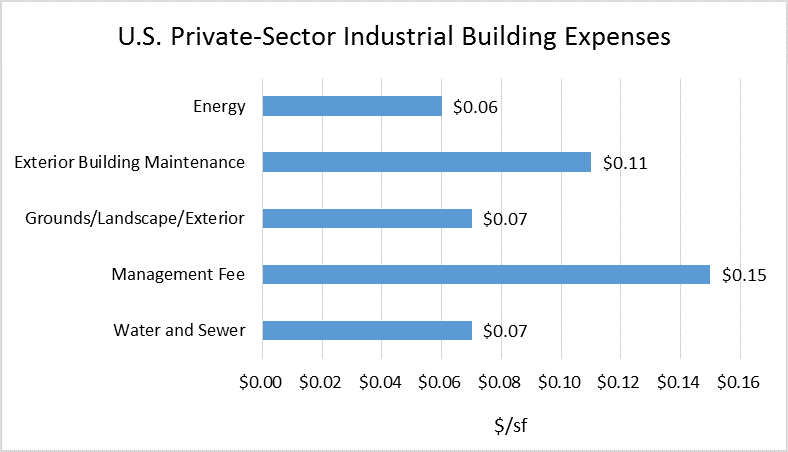
U.S. Private-Sector Industrial Building Expense Figures
- Total ongoing expenses: $1.39 psf
- Energy: $0.06 psf
- Exterior building maintenance: $0.11 psf
- Grounds and landscape: $0.07 psf
- Management fees: $0.15 psf
- Water and sewer: $0.07 psf
 Both the Office EER and Industrial EER consist entirely of voluntarily reported data from office and industrial property owners and managers. These interactive online databases allow users to generate customized reports using various search filters, including building size, type, class, market, submarket and more, with results calculated in real time. Reports are downloadable as both Excel and PDF documents, and a subscription grants unlimited access, with no limit to the number of reports users can generate.
For more information and to subscribe to the 2016 Office EER and/or 2016 Industrial EER, visit the BOMA EER Web site.