October 2016 — Security costs are a combination of labor and IT (cameras and security monitors). However, for most organizations the majority of the costs are labor, so how do you know if you are staffed correctly, paying the right wage, or if your workforce is being productive? Do you need to staff for a 24 X 7 operation or could you automate the process and run it from another location.
Most organizations are still getting requests to cut budgets or somehow maintain the same budget with wage increases. The usual reaction is, “We can’t cut it any further without having unsafe or unguarded facilities.” The reality is, you really don’t know if you can cut some more safely unless you can compare to some similar buildings and see how they are doing with their security costs.
When security budget cuts and cost increases are coming your way it would be ideal to know how other facilities are managing their costs. Maybe some are operating just fine on less or maybe what is being requested of you will result in a security cost that’s lower than anyone else. It is nice to be low in costs but you never really want to be the “lowest” cost for providing a critical service like security. It would be really helpful, to explain to management where you stand on security costs in a focused, rational way. Direct comparisons with a valid peer group would be invaluable and appropriate in making the correct decisions.
What is needed are benchmarks to show how your organization is managing the security costs. Let’s look at some of the options that would support your position with management.
Let’s start with the Key Performance Indicators (KPIs) for security services. The usual KPIs for security work are:
- Security cost per secured area
- Security cost per full time employee
- Area secured per security worker
When run against a valid peer group these KPIs show how your security costs compare with others. Figure 1 shows a chart with the KPIs listed above for a peer group based on your criteria. This is a chart showing the comparison for facilities. One thing that really stands out: nearly all the facilities on this chart are operating at about the same level. Security services are looking like a commodity when the costs are reported in this manner for such a large group of facilities.

Figure 1 – Security Cost per GSF
Filters: Size of facility 250,000 – 599,000 GSF and Site Type: Campus
Provided courtesy of FM BENCHMARKING
This chart allows you to see at a glance how well your facility is performing its security functions. There are 448 buildings in this peer group with a median security cost per GSF of $1.06 and a first quartile performance of $0.95 per GSF. By comparing similar types of facilities, you will be able to make intelligent “data driven” decisions. The Security Director, for this example, has calculated his security costs at $1.35 per GSF which is near the middle of the fourth quartile. This is about 50% higher than the first quartile costs and is an expensive fourth quartile performance; we need to investigate further as to the reasons of this costly performance.
What are some other ways we can compare our performance? We said earlier that security costs are mostly labor so we should look carefully at our labor utilization rate to see why our costs are so far above the 1st quartile results. Let’s look at how we compare, for the same building filters, with our security staffing levels. The KPI with security staffing is area cleaned per full time security worker.

Figure 2 – AREA SECURED PER FULL-TIME SECURITY WORKER
Filters: Size of facility 250,000 – 599,000 GSF and Site Type: Campus
Provided courtesy of FM BENCHMARKING
Figure 2 shows the median area secured per worker is 15,549 GSF with a first quartile (working right to left in this case) of 18,000 GSF. The facility director, in this example, calculates his security workers’ performance at 14,310 GSF per person which is a high third quartile performance.
One other factor to consider would be the building occupancy. Security costs are significantly affected by the number of occupants in a facility. If a building has a high occupancy then the security costs should be higher than in a building with a low occupancy.
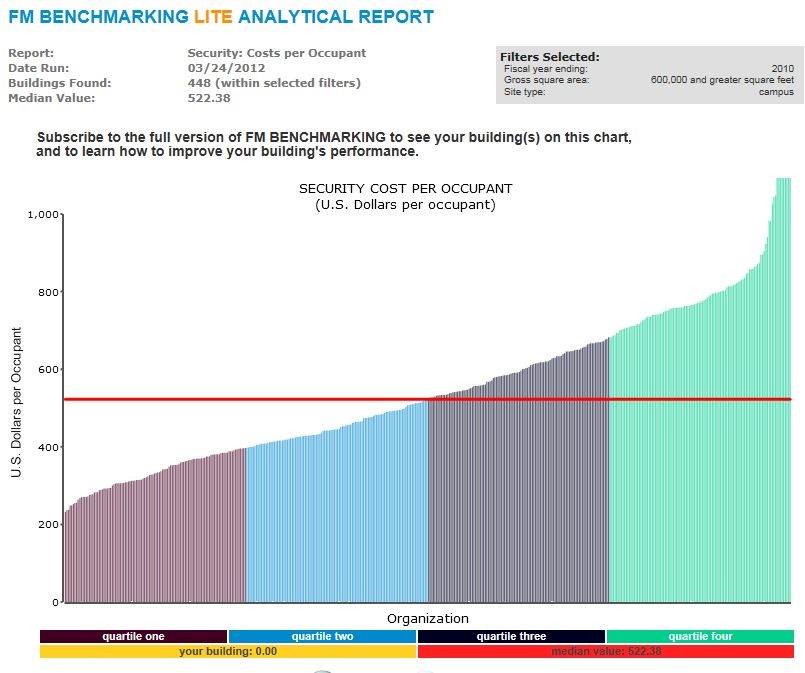
Figure 3 – SECURITY COST PER OCCUPANT
Filters: Size of facility 250,000 – 599,000 GSF and Site Type: Campus
Provided courtesy of FM BENCHMARKING
The above chart shows the median cost per occupant at $522 with a first quartile performance of $398 per occupant. The facility director, in this example, calculates his security cost per occupant at $603 which is near the middle of the third quartile performance.
It looks like the all of the KPIs for this example are in the third and fourth quartile. Most likely there are a combination of causes such as excessive staffing, high wages, and possible a higher than required level of services. All could be contributors to explain why the security costs are so high.