Most facility managers use some type of performance based specifications in contracting for custodial services. Labor is the most significant component in custodial service contracts so the cleaning frequencies that you specify has a very direct and significant impact on the cost of your custodial services.
How do you determine the correct or appropriate frequency? One approach would be to use benchmarking to see what frequency others are using and then visit or talk with some of those peers to review the service levels.
Step 1—Ask the appropriate questions to determine the current cleaning frequencies
Custodial Cleaning Frequency Survey—Based on your routine cleaning frequencies, indicate the value of the most frequent cycle from the following table listed in order most to least frequent…
| C7. General offices dusting frequency. | Level of Service |
| C8. General offices trash removal frequency. | Level of Service |
| C9. General offices vacuuming frequency. | Level of Service |
| C10. Hallway areas floor care frequency (vacuuming, mopping, or dusting). | Level of Service |
| C11. Hallway areas trash removal frequency. | Level of Service |
| C12. Reception areas floor care frequency (vacuuming, mopping, or dusting). | Level of Service |
| C13. Reception areas trash removal frequency. | Level of Service |
| C14. Production cleaning frequency (trash removal, vacuuming, mopping, and dusting). | Level of Service |
| C15. Lab cleaning frequency excluding clean rooms. (trash removal, vacuuming, mopping, and dusting). | Level of Service |
| C16. Rest rooms cleaning frequency. | Level of Service |
| C16A. Rest rooms total square feet (000) | Level of Service |
| C17. Cafeteria cleaning frequency. | Level of Service |
| C17A. Cafeteria total square feet (000) | Level of Service |
Step 2—Analyze the responses
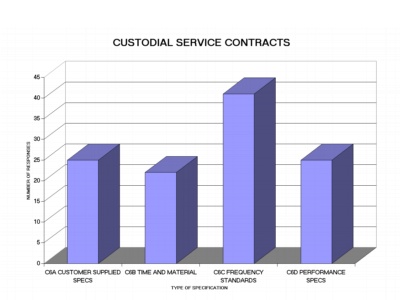
The first step is to analyze how Facility Managers typically contract for custodial services. The chart below shows that Frequency Standards are the most frequently used method to define service levels along with Customer Supplied Specifications.
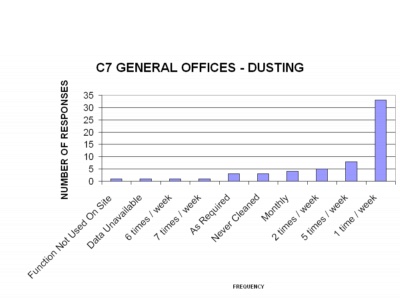
Then look at how frequently your contactor performs any of the custodial tasks that are in their scope of services. The chart below shows most organizations dust their offices once per week. The next most common frequency rate is five times per week which is a significant jump in service levels and costs.
Step 3—Using This Information
You should review your frequency rates with a peer group to determine what levels of service others are using. A good comparison would also involve site visits to organizations that have implemented the service level frequencies you are considering. This allows you to report to the users that the service levels are reasonable and consistent with their expectations of cleanliness.
Metrics from the Facility Managers Round Table (FMRT)
In 2005 there were 92 unique sites in the FMRT with a median size of about 1,400,000 million square feet. See the chart below to see how the group looked by industry type.

Space Metrics
- Space Utilization 430 Gross Square Feet per Occupant
- Cost Metrics
- Utilities $2.17 / GSF
- Custodial $1.33 / Cleanable SF
- Maintenance $1.69 / GSF
- Parking and Paving $1529 / Acre
- Groundskeeping $3405 / Acre
- MAIL $0.73 / GSF
- Mail Services $0.22 / GSF
- Environmental Health and Safety $0.35 / GSF
- Fixed Costs (Includes: Building, Leasehold Improvements, Furniture/Equipment) $ 3.71 / GSF
Move / Churn Cost Metrics
- Box Move Costs $317 / Person Moved
Customer Satisfaction
- Satisfaction With Overall Facilities Services 3.80 on a 1 to 5 scale