Satisfaction surveys are a common business tool to measure the quality of the service delivery process. For the purposes of this article we will be review just one method… Facilities Group Global Web Surveys. These surveys are run on a periodic basis from quarterly to annually. To be statistically valid they should be distributed to a significant portion of your customers. The most efficient process is to distribute an email to the occupants of your facility and include a link to a web based survey.
A portion of an typical survey follows. For brevity we are only showing one section but there are normally 8 or 9 groupings to a typical survey. The important point to note is that you need to collect both IMPORTANCE and SATISFACTION ratings from your occupants.
Occupant Satisfaction Survey
The General Services Team is interested in feedback regarding your satisfaction with the services provided. Your thoughts are important to us. It will take approximately 5 minutes to complete this questionnaire.
Your survey results are confidential and contact information is optional. However, if you have specific comments or suggestions, or want to be eligible for the drawing, we need your name and phone number.
Please complete your survey today. Thanks for your assistance.
Please indicate your response by clicking on the circle under the appropriate number on each question for both the importance of the question and your satisfaction level. If you do not have an opinion, or if you have no experience with the question topic, click on the N/A checkbox.
Importance
- Extremely Unimportant
- Very Important
Satisfaction
- Extremely Dissatisfied
- Very Satisfied
After you have run your survey and compiled the results the usual question is… “What is the best way to analyze the data?” We have recently started compiling the results in an Importance – Satisfaction chart. This chart very easily provides the facility manager with a snapshot showing the services where the importance is higher than the satisfaction rating. A sample chart is shown below.
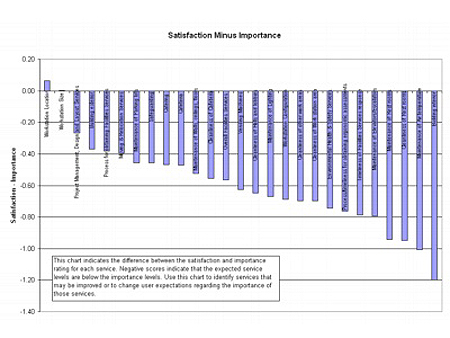
Note the items on the far left side of the chart show a neutral, small positive or small negative result for the various services. The users rate the importance and satisfaction at about the same level. Over on the far right of the chart is another story. The users feel the building interior and air temperature are important but they are not very satisfied with the result.
Some Best Practices…
- Many organizations establish performance targets and measure their results on a monthly basis to monitor how they are doing. This allows time to make changes if the results are not what was expected.
- Other organizations use their occupancy survey results with focus groups to modify their service levels. It is important to note that satisfaction surveys help measure where under and over delivered. They often help identify opportunities for cost cutting without reducing satisfaction level.
Metrics from the Facility Managers Round Table (FMRT)
In 2006 there were 78 unique sites in the FMRT with a median size of about 1,450,000 million square feet. See the chart below to see how the group looked by industry type.
Space Metrics
- Space Utilization 430 Gross Square Feet per Occupant
- Cost Metrics
- Utilities $2.17 / GSF
- Custodial $1.33 / Cleanable SF
- Maintenance $1.69 / GSF
- Parking and Paving $1529 / Acre
- Groundskeeping $3405 / Acre
- Security $0.73 / GSF
- Mail Services $0.22 / GSF
- Environmental Health and Safety $0.35 / GSF
- Fixed Costs (Includes: Building, Leasehold Improvements, Furniture/Equipment) $ 3.71 / GSF
Move / Churn Cost Metrics
- Box Move Costs $317 / Person Moved
Customer Satisfaction
- Satisfaction With Overall Facilities Services 3.80 on a 1 to 5 scale