Facilities managers are usually looking for better ways to clean and provide a better, more healthful, environment for the occupants. But janitorial services are often the first things to be cut in any budget reduction initiatives and it’s very difficult to get the funds back when the economy improves. Many clients and attendees at conferences readily admit that their facilities are “moderately dingy” and would like to do something to improve the appearance and cleanliness of their facilities.
Benchmarking can help you understand how your costs compare with others in your peer group and may be able to help you justify budgeting additional funds.
Most FMs are familiar with benchmarking concepts. You enter your cost data, occupancy, and areas, as shown in Figure 1.

From this data any benchmarking system should be able to provide a normalized cost comparison. This kind of benchmarking system shows where you stand compared to your peers as in the example below. Figure 2 is filtered by the gross area of our facility all buildings greater than 600,000 sq. ft. and by the type of facility—office. Note that our building is in mid-range of the second quartile with a janitorial cost of $435 per occupant. The cost performance seems okay, but you note that you have been receiving a lot of complaints regarding the janitorial performance. Does the funding need to be increased or is the work just not getting done?
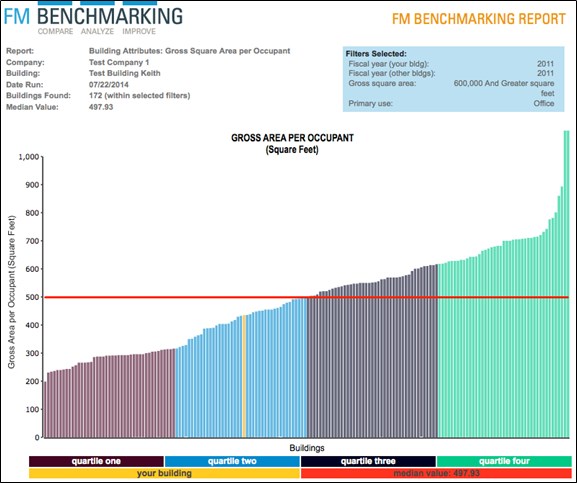
As discussed earlier, any benchmarking tool should be able to provide this type of report. And, any facilities manager looking at this chart should be asking the question, “What do I do to get better or reduce the level of complaints?” Based on the cost performance, compared with the peer group, it doesn’t look like there is a funding problem.
A good benchmarking tool will provide you with the information to answer that question. Figure 3 shows the first six best practices from the FM BENCHMARKING application for janitorial services.
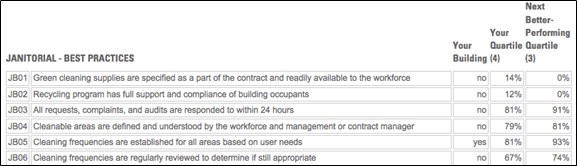
To improve your building’s janitorial performance and reduce the level of complaints, you need to know what to change in your facility. A way to do that is to compare what others are doing with janitorial best practices. Note that for the first six best practices, we have not applied five of them in our facility. Note also the percentages that have been applied by our peer group in our quartile (4th, which is the worst) and the next better performing quartile (3rd). Three of these best practices have about 80% implementation rates in our quartile. And those in the next better performing quartile have even higher implementation rates. Using the best practices tables would be a good way to improve the overall quality of the service delivery. Using this best practices analysis, we could carefully determine which best practices would have the highest benefit to improving janitorial services. By applying these, you are sure to improve your performance.