Can you easily show your space utilization performance trends on a year-by-year basis? Effective space utilization can have the most significant payback of any initiative taken by the facilities management group. Changing space utilization can be simple or complex, depending upon the space standards and options available to increase the density. Consider these alternative initiatives for a 1,000,000 square foot (SF) campus.
Option 1 — Focus on reducing operating costs:
- Reduce your maintenance costs by 10% →
Save about $0.20 per SF - Reduce your utility expenses by 10% →
Save about $0.25 per SF - Reduce your janitorial costs by 7% →
Save about $0.10 per SF - Option 1 Total Savings is about $0.55 per SF = $550,000
Note: The savings shown are typical from those who benchmark, and represent the percentages saved by the median company for each of the operating cost areas shown for each the last five years.
Option 2 — Focus on effective space utilization:
- Improve space utilization by 10% →
Reduce space by about 100,000 SF - Total median operating costs savings →
$6.50 x 100,000 = $650,000 - Total median fixed costs savings →
$5.50 x 100,000 = $550,000 - Option 2 Total Savings is about $12.00 per SF = $1,200,000
Option 2 as shown does not include additional savings from the release of space from the inventory (either by not renewing it or by leasing it); this would increase considerably the total dollars saved.
From the example above it is clear that the highest “value add” from the FM organization would be to implement effective space utilization and benchmark the progress. Did you know that data entered in a benchmarking system can be used to document your improvements? This is a straightforward process that shows the importance of the FM position in the organization. Without good benchmarking comparisons, you may not even realize that space can be more effectively utilized and the overall facilities footprint may be reduced. As you can see, a case easily can be made for benchmarking that will justify the minor amount of staff time.
The examples used to illustrate how easy the process should be are from FM BENCHMARKING; this approach will allow you obtain the key output reports in the minimum amount of time. In the following example we benchmarked space utilization performance and noted some “best practices” that were implemented in 2010. Then the benchmarking results can be used to show areas for improvement which can be used to justify additional initiatives to improve space utilization.
Focus on the KPI (Key Performance Indicator) for space utilization metrics that need to be benchmarked: Space utilization — Gross Area Per Occupant.
Here is the straightforward process:
- Look at our benchmarked space utilization for FY 2010.
- Review the proposed best practices.
- Implement the changes (after approval of the proposed recommendations).
- In a year, review the 2011 benchmarked space utilization (to see how the implemented best practices affected our performance).
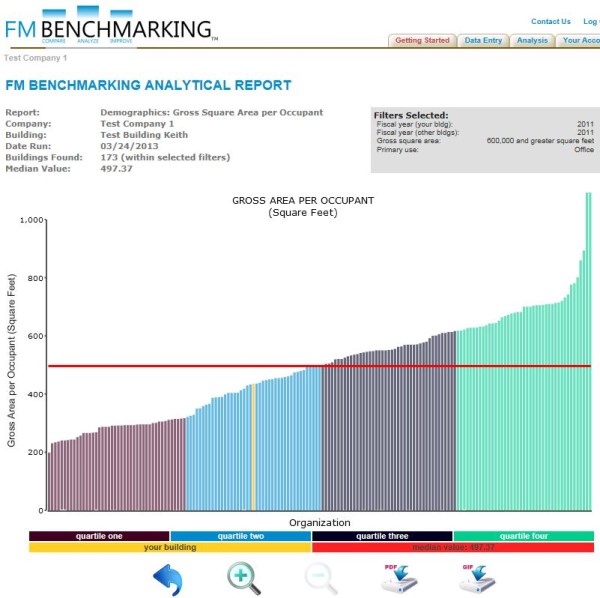
Figure 1 shows our space utilization performance compared with our peer group of other office facilities. This allows you to see at a glance how our facility compares with other office buildings. There are 348 buildings in this peer group with a median space utilization cost of 500 gross square feet per person. Our building (in yellow) is right at the median with a space utilization of 500 GSF per person. With just middling performance, there is room for improvement. By looking benchmarking data in this way and comparing similar types of facilities, you will be able to make intelligent “data driven” decisions.

Filters: Type of facility (Office); Size > 600,000 GSF
The FM Leadership Team looked at this performance and decided they could improve it. There were some initiatives they considered and recommended to management:
- Reduce the space standard for a standard open plan cubical from 8′ X 10′ to 6′ X 8′.
- Implement a “charge back” application so the users would understand that their space wasn’t “free”.
- Increase the occupancy by about 400 people and eliminate 200,000 GSF of leased space for a savings of about $2.7 M.
A year later the benchmarked space utilization showed:
Filters: Type of facility (Office); Size > 600,000 GSF
So by reducing the workstation size and encouraging the more effective management of space with a charge-back system the facility is experiencing more effective space utilization. An additional 400 employees have been added to the facility, increasing the occupancy utilization to about 435 GSF per person. Going forward the FM Leadership Team plans to consolidate additional staff into the facility which will further increase the space utilization.
Conclusions
Using the results from benchmarking, the FM can make proven recommendations that will reduce space utilization costs and improve space utilization performance. The company achieved:
- Space utilization cost savings by implementing more effective space utilization.
- A better performing organization in closer proximity to each other.
- Improved levels of service or no degradation of service.