by Brianna Crandall — April 20, 2015—Technology talent clustering is a growing driver of demand for office space in both large and small markets across the United States, according to a new report from CBRE Research, an arm of global commercial real estate (CRE) services and investment firm CBRE Group. The report, “Scoring Tech Talent,” ranks 50 U.S. markets according to their ability to attract and grow tech talent.
While established tech markets like San Francisco, Washington, DC, and Seattle dominated the top spots on the “Tech Talent Scorecard,” many smaller, up-and-coming markets stood out as top “momentum markets” based on tech talent growth rates. Oklahoma City and Nashville had tech talent growth rates of 39% between 2010 and 2013, higher than Seattle (38%) and just below that of San Francisco (44%) and Baltimore (42%). Portland, OR, and Charlotte, NC, both saw tech talent growth rates of 28%, outpacing well-known tech markets like Austin (26.5%), Silicon Valley (20.8%) and Los Angeles (13.6%).
“Tech talent growth rates are the best indicator of labor pool momentum and it’s easily quantifiable to identify the markets where demand for tech workers has surged,” commented Colin Yasukochi, director of research and analysis for CBRE. “Tech talent growth, primarily within the high-tech industry, has recently been the top driver of office leasing activity in the U.S.”
Though tech talent comprises only 3.4% of the total U.S. workforce (4.4 million workers), the high-tech industry accounted for more major U.S. office leasing activity than any sector in both 2013 (13.6%) and 2014 (19.0%), according to the CBRE report.
“For the past two years, the high-tech industry has not only spurred the economy as a whole, but it has been the top driver of commercial office activity, influencing rents and vacancy in major markets across the U.S.,” added John Frager, executive managing director of CBRE’s Tech and Media Practice. “The report showed Manhattan with the highest office rent and San Francisco with the lowest vacancy rate of the 50 tech talent markets.”
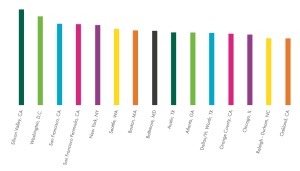
The top 10 large markets on the Tech Talent Scorecard (identified as markets with a talent pool above 50,000 tech professionals) are:
- Silicon Valley, CA
- Washington, DC
- San Francisco, CA
- San Francisco Peninsula, CA
- New York, NY
- Seattle, WA
- Boston, MA
- Baltimore, MD
- Austin, TX
- Atlanta, GA
Dallas, Orange County, Chicago and Raleigh-Durham took the #11, #12, #13 and #14 spots on the list before a small market—defined as a market with a tech talent labor pool of less than 50,000—made its way onto the list. The top-ranked small markets include:
15. Oakland, CA
16. Edison, NJ
23. Columbus, OH
25. Salt Lake City, UT
26. Portland, OR
27. Newark, NJ
29. Long Island, NY
30. Kansas City, MO
31. Charlotte, NC
33. Cincinnati, OH
The report also looked at which markets present the greatest cost for occupiers based on wages paid to employees and rent paid for office space. CBRE Research combined these two costs for a “typical” 500-person tech firm needing 75,000 sq. ft. of office space for each market and found that, for large markets, Silicon Valley is the highest cost and Detroit is the lowest cost. For smaller markets, Oakland is the highest cost and Oklahoma City is the lowest cost.
The CBRE report also identified various characteristics that are shared by tech talent markets—namely, gender diversity, level of education, and the presence of Millennials in the workforce.
“Though highly concentrated within the high-tech services industry, tech talent is not limited to any one type of company and can be found across all industry sectors. In fact, more than 60% of tech talent jobs are located outside of the core high-tech industry and these workers help generate innovation and advances that can boost the whole economy, including the commercial real estate market,” pointed out Yasukochi.
The interactive report summary is available on the CBRE Web site, and the complete report is available with a CBRE Global Research Gateway account.


