October 2020 — Securing your facility, especially during the COVID 19 pandemic, is critical. Many FMs want to limit access to selected portions of the facility to be sure cleaning is performed per protocols. Employees, if not restricted, will gain access to other and closed areas of the facility that probably are not being regularly cleaned. During the pandemic, thieves, vandals, active shooters, disgruntled ex-employees, corporate spies, and others can gain access to many facilities simply by walking through unlocked front doors, shipping areas or tailgating at employee entrances. We visit many sites over the course of a year, and most employees will even hold the door open for us. After gaining access to the facility, these intruders are free to roam the facility looking for opportunities. The key to effective security is to control access.
The trend, however, even during the pandemic, is to provide security controls with fewer guards and staff and use more electronic access controls. It is easy to understand why since electronics limit the exposure of the virus to security staff. Staff may even have resigned over health concerns, and your contractor may be having difficulty filling the positions. For FMs this issue is difficult to resolve. Most are experiencing cost pressure to find better ways to provide better, cost-effective security services that are oriented towards providing a safe workplace.
It often seems that only poor and poorer choices are available to resolve these issues:
- Rebid the contract to try and obtain adequate staff with less turnover.
- Reduce staffing levels by closing manned access points; this forces employees to enter the building at less convenient locations.
- Utilize card-readers at unmanned locations, which results in less control and tail-gating by employees as well as unauthorized intruders.
- Install more cameras—not really a security enhancement technique since cameras only provide info after the fact.
Benchmarking can identify whether you are spending on a par with similar companies
There is only so much that can be done and still have a safe facility that meets corporate and employee requirements. Security benchmarking can help you understand how your costs compare with others in your peer group and may be able to help you justify additional budget funds. Most FMs are familiar with benchmarking concepts. You enter your cost data, occupancy, and areas. From these data, a good benchmarking system should be able to provide a normalized cost comparison for security services. This kind of benchmarking system shows where you stand compared to your peers.
Figure 1 below shows how much the security services cost on a normalized basis compared with those from other office facilities. There are 339 buildings in this peer group with a median security cost per gross square foot of $1.37 and a first quartile performance of 1.19 per gross square foot. Our security cost is above the median, in the second quartile, shown in yellow, with a cost of $1.25 per gross square foot.

Figure 1 – Security Cost per Gross Square Foot
Filters: Office Facilities
Provided courtesy of FM BENCHMARKING
A facility manager or security manager looking at this chart would probably ask the question, “What do I do to get better, reduce costs, and improve the overall security levels in and around my facility?” The costs are below the median but still relatively high, and we know that security costs are mostly labor, so we should be looking at options that would better utilize the security workforce. Let’s see how we compare with the workforce utilization rate…
Figure 2 below shows the area secured per security worker compared with that of other office facilities. There are 344 buildings in this peer group with a median area secured of 14,194 gross SF/security worker and a first quartile performance (the border between the first and second quartiles) of 15,750 gross SF/security worker. Our facility performance is better than the median (more square feet covered per worker), in the first quartile, shown in yellow, with a performance of 21,371 gross SF/security worker.
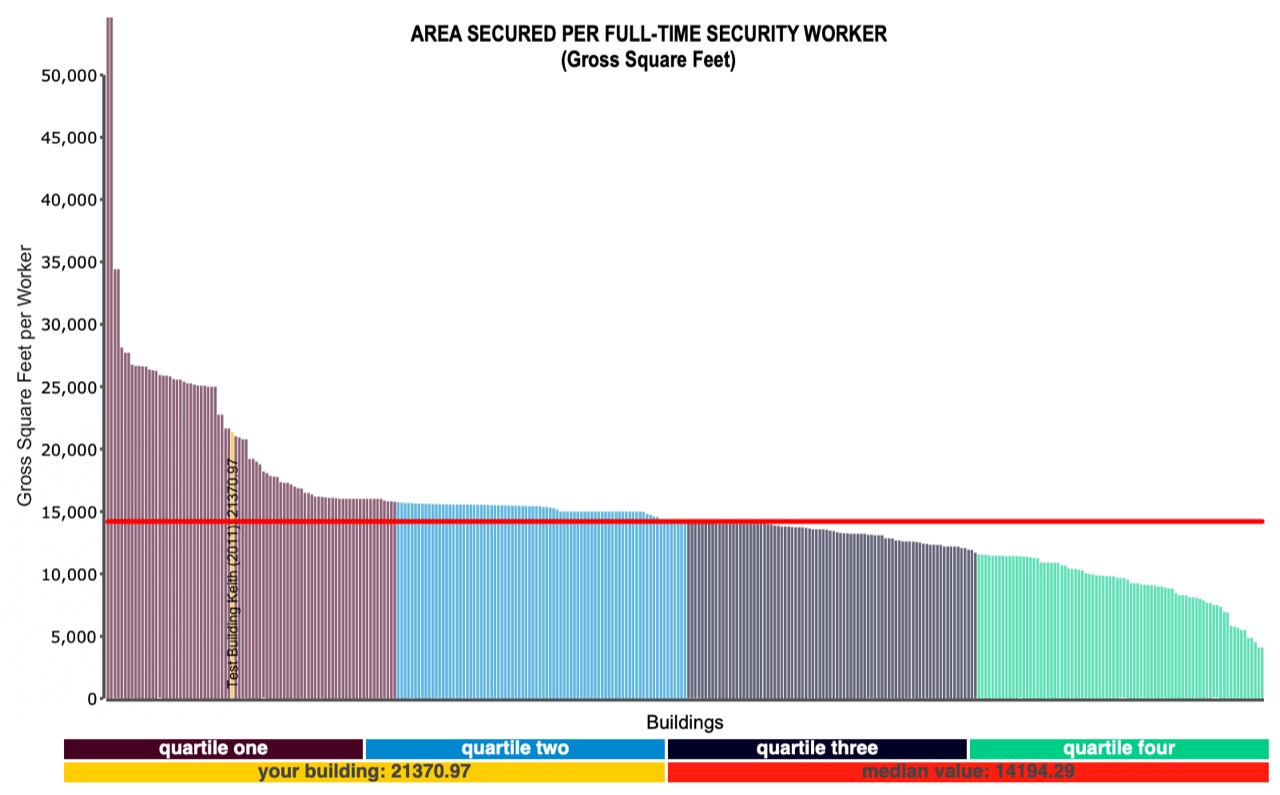
Figure 2 – Area Secured per Security Worker
Filters: Office Facilities
Provided courtesy of FM BENCHMARKING
The chart shows that we are low on the number of security workers but in a higher place on the benchmarking graph compared with the costs as shown in Figure 1. Although we probably would find it difficult to improve further, to see what we can change to improve performance, we can look next at which “best practices” could be implemented. That is something we would definitely do if our performance were in the third quartile. FM BENCHMARKING does enable best practices analyses, where one can see which best practices similar companies are doing when in a higher performance quartile.