Many FMs participate in benchmarking programs to see where they stand in comparison to their peers. We find there are two groups of FMs that get involved in benchmarking and their reasons are significantly different:
- Senior management wants to know if the FM group is providing services at an appropriate cost, so they have requested that the FM organization benchmark their services.
- The FM Organization initiates benchmarking to understand how their performance compares with others and what could be done to improve service and reduce costs.
For the first group, FMs usually are interested only in a “scorecard” to show Senior Management that their performance is acceptable. It is the second group that really grabs hold of benchmarking and uses it as a continuous improvement process to show where they stand and what can be done to improve.
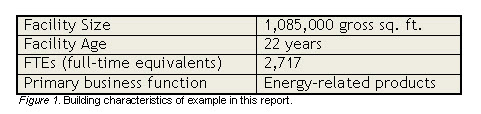
Let’s look at a few examples from one building in the FM BENCHMARKING database, to see the value that benchmarking can bring for the second group. This building is a large, older building whose occupants are in the energy sector (see Figure 1).
Space Utilization
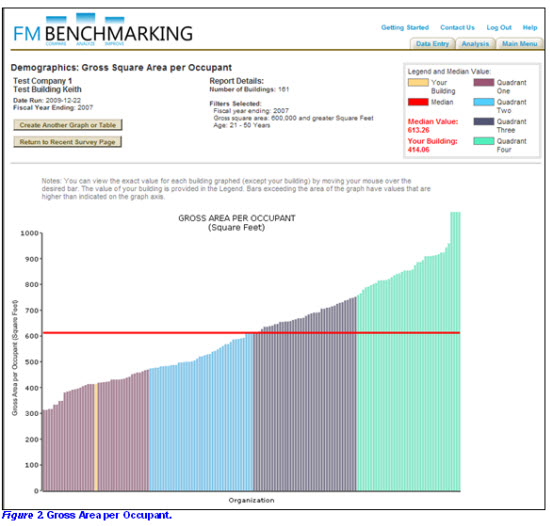
One of the first questions likely to be asked by either senior management or the FM organization is, “How effectively are we utilizing our space?” In this example, as shown in Figure 1, we are doing just fine. Our building is shown in yellow and is near the middle of the first (best) performance quartile with a space utilization rate of 414 GSF per person.
This is an interesting piece of information and suggests that we are doing a very effective job of space management and utilization. However, note that while we have applied filters (see the top part of Figure 2) so we are comparing our building only to others that are large, older buildings, we have not yet turned on any other filters, such as one to look at only buildings in our energy industry. By thinking of benchmarking as an iterative process, one learns that by experimenting with filters, one can get much more meaning out of the benchmarking exercise.
Utility Costs and Consumption
Energy costs are usually the largest component of operating expenses so we should look carefully at these benchmarking metrics. But what is the most appropriate metric? If you ask the CFO (Chief Financial Officer), he will respond that cost is the only important measure. That is an important measure but probably not the most important one for the FM organization. A more important indicator for the FM Organization would be energy utilization per GSF. Let’s look at both to see how our example facility is doing.
On Figure 3 below you can see that our total utility costs are well into the third quartile with a cost of $2.74 per GSF, which is not very good.

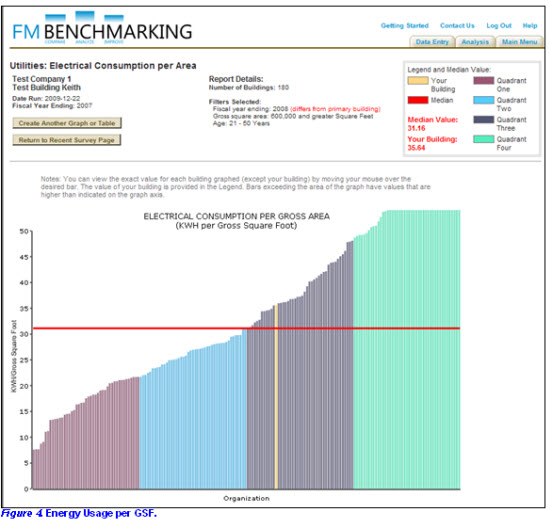
FMs can’t do too much about the cost of energy but they can impact the quantity used in significant ways. For FMs a better metric for comparison would be the electrical consumption per gross square foot.
In Figure 4, you can see that our sample site is much closer to the median (rather than the fourth quartile) on energy consumption. This change may be because we are in a geographic area whose electrical rates are higher than most.
Nonetheless, our building’s performance still is in the third quartile, which means there is a lot of room for improvement. So far, the metrics we have studied serve only to tell us how we are doing compared to other similar buildings. The filters have helped us to ensure that we have accurate comparisons. Now, however, it is time to understand what can be done to improve our building’s performance, to get it into the second quartile. For this to happen, we need to examine the best practices we are employing in our building.
Best Practices to Reduce Utility Costs and Consumption
We’ll continue our example by delving deeper into the database in FM BENCHMARKING, focusing on the best practices we are using for utilities in our building, and comparing them to those who are consuming less electricity.
Figure 5 below shows some of the ideas and concepts that have been implemented by those in the next better-performing (second) quartile (the area in blue on Figure 3). There are many more identified in the database, but these illustrate the concept of studying best practices to identify which may be most effective to reduce our building’s electrical consumption.
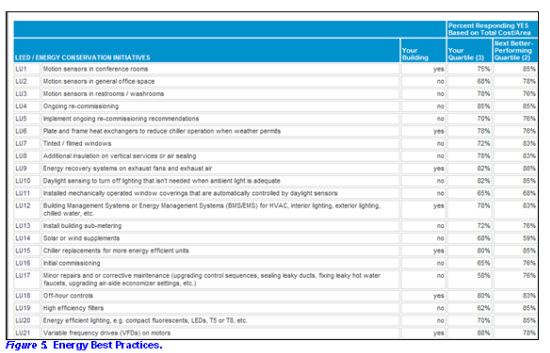
Benchmarking participants who want to improve need only to look at what those in the next better performing quartile have done and install or implement those practices in their organization. Focus on the best practices that are not being done for your building; then see which of them are being done my most of the others.
For example, by looking at the second line (LU2: Motion sensors in general office space), we see that not only are we not doing this, but there is a large jump between the second and third quartile in terms of the percentage of those who have added motion sensors to their general office space. Thus, this may be a good one to implement. As a general rule, when over 75% of others have implemented a best practice, it is one that should be considered. Similarly, those for which there are jumps of 10% or greater between “your performance quartile” and those of the next better-performing quartile may be considered significant.
By looking at the fourth line (LU4: Ongoing re-commissioning), even though there is not a “jump” between the percentage of buildings in the second and third quartiles, we see that nearly everyone (85%) in both quartiles is doing this, while we are not. This, then, becomes another best practice worthy of our consideration.
This use of best practices, when combined with the comparison of building metrics from the charts, is an easy concept to understand, and should be easy to explain and justify changes to management. It is always easier to obtain approval when you can show that others with higher performance have implemented the concepts and achieved savings from the ideas.
1While many of the numbers shown in this article will be valid for many types of situations, they can be considered accurate only for those in buildings where similar filters apply.