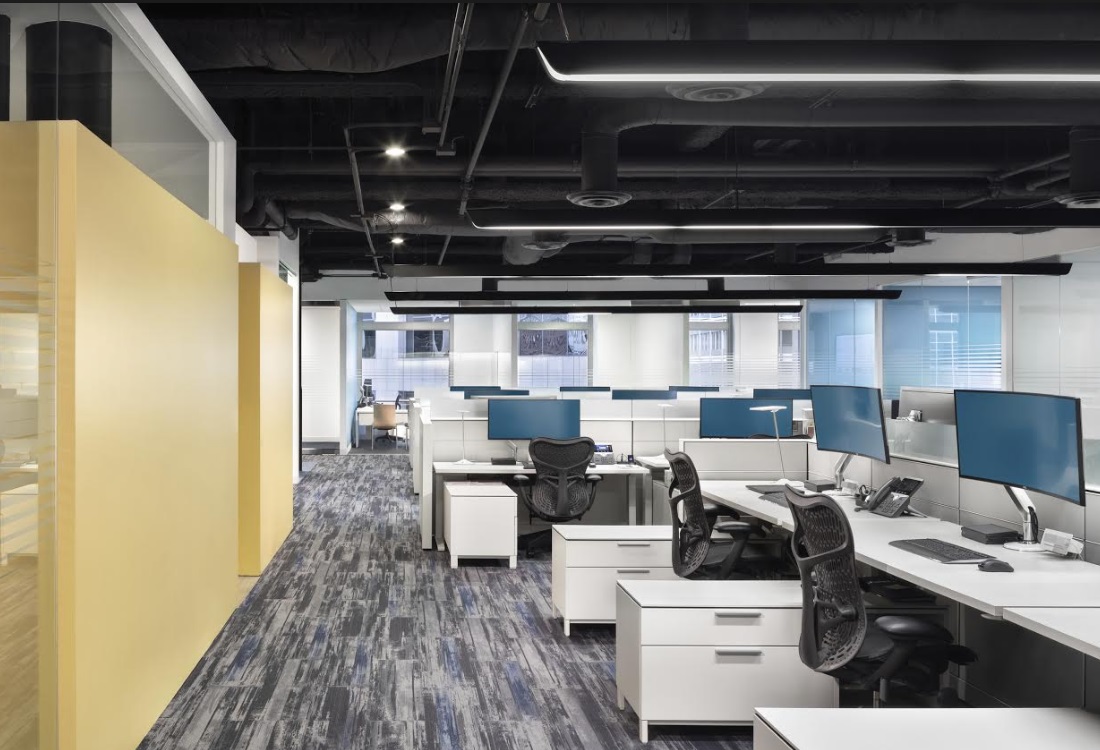
Photography Credit: Blake Marvin Photography
by Cynthia Milota, Director, Workplace Strategy, Ware Malcomb — October 2020 — There is much conflicting information in the press about the office during the global pandemic. How much square footage (SF) will organizations need when their employees return to the office (RTO)? How many employees will companies welcome back to the re-imagined office? The near-term calculations show that up to 50% more SF will be required (JLL, 2020), due to social distancing requirements. The longer-term speculations offer that organizations will require less SF as all their employees will never return to the office 5 days per week.
Workplace Metrics measure and analyze the office space.
To explore Employee Experience measures, read Post occupancy evaluations: Working the bottom line in employee Experience.
In efforts to manage disruption with data, Facility Managers (FMs) are confronted with key issues:
- Dichotomy of greater SF per person and a smaller corporate real estate footprint
- Uncertainty of when the workforce will return to the office
- Ambiguity of scenario planning for what’s next
The applicable workplace data to respond to these factors will be unique for every organization. Facility Managers can use this COVID opportunity to size up their unique needs to measure, estimate, and anticipate the magnitude/difficulty of managing office space in the current landscape and beyond.
Metrics that Matter
In their 2019-2020 Occupancy Benchmarking Guide, JLL identifies the metrics most organizations gather: occupancy/vacancy; utilization level; density; cost/seat; mobility ratios and open positions (JLL, 2020). Figure 1 outlines the definitions of common measures and the COVID implications of each.
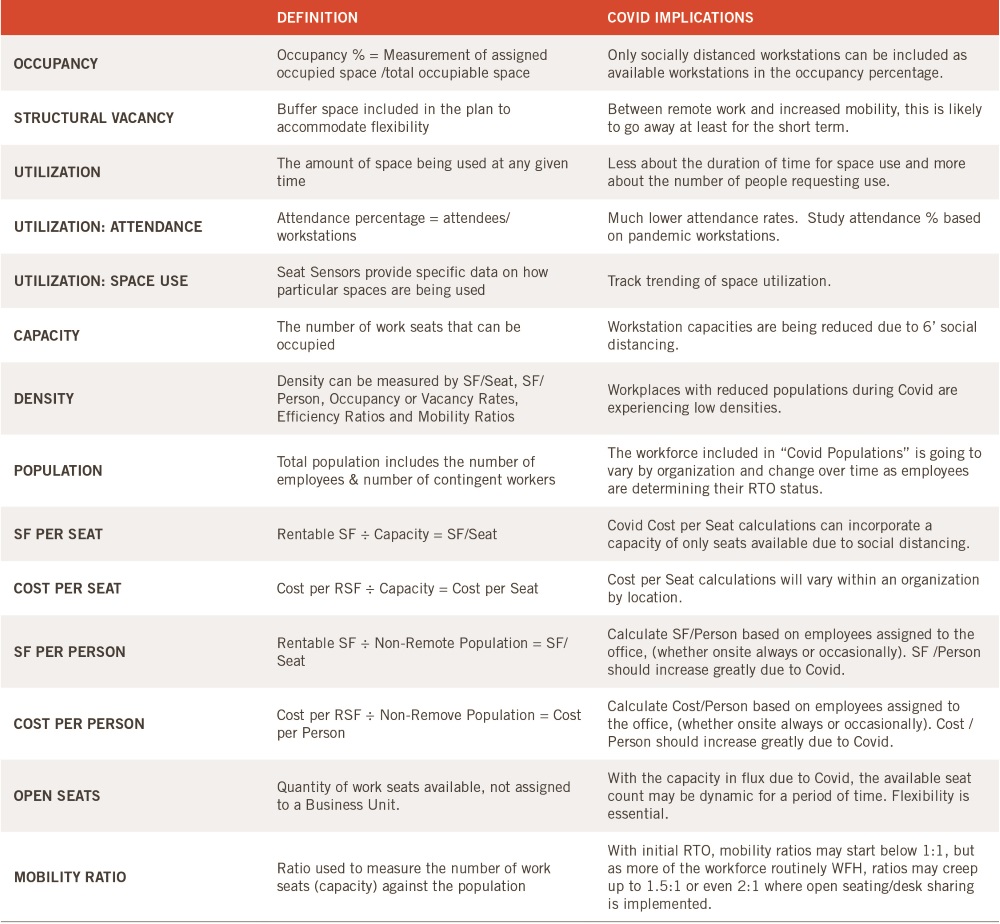
Figure 1: Workplace Metrics defined with COVID Implications
Facility Managers utilize various methods to gather and analyze these metrics, including Integrated Workforce Management Systems (IWMS) which integrate SF and personnel metrics and Occupancy Planner positions, who work with the Business Units, Corporate Real Estate and the Facilities teams to measure, assess and scenario plan for data driven decision making.
COVID Specific Measures
Quantitatively managing space and employee utilization in a COVID environment demands FMs monitor new unique factors. Not all metrics will provide relevant data for all circumstances, but many of these measures will likely remain in the evolving Facility Management lexicon.
Calculate Number of Employees On-Site
Using surveys or 1:1 manager’s interviews with employees, assign the workforce into categories for Return to the Office (RTO), based on their personal circumstances and work requirements. Each organization’s categories will vary. A sample breakdown follows:
On-Site Always: employees/contingent workers required to be in the office, e.g. security, operations, engineering, information technology, certain business units (3-5 days per week)
On-Site Occasionally: employees in the office a few days per week (1-2 days per week)
Mostly Remote: employees in the office a few days per month (2-3 days per month)
Only Remote: employees who work virtually and may only come to the office on rare occasions.
Understanding the mix and quantity of employees by on-site category will drive to a total population number.
Calculate Available Capacity
As jurisdictions allow return to the office in phased occupancy, capacity measures at 20% – 50% – 75% become important. Figures 2 and 3 calculate capacity scenarios. Figure 2 assumes a close to 1:1 mobility ratio, while Figure 3 explores an unassigned model, with a 1: 1.2 mobility ratio.

Figure 2: Chart calculating capacity at 20-50-75% for 1:1 mobility ratio
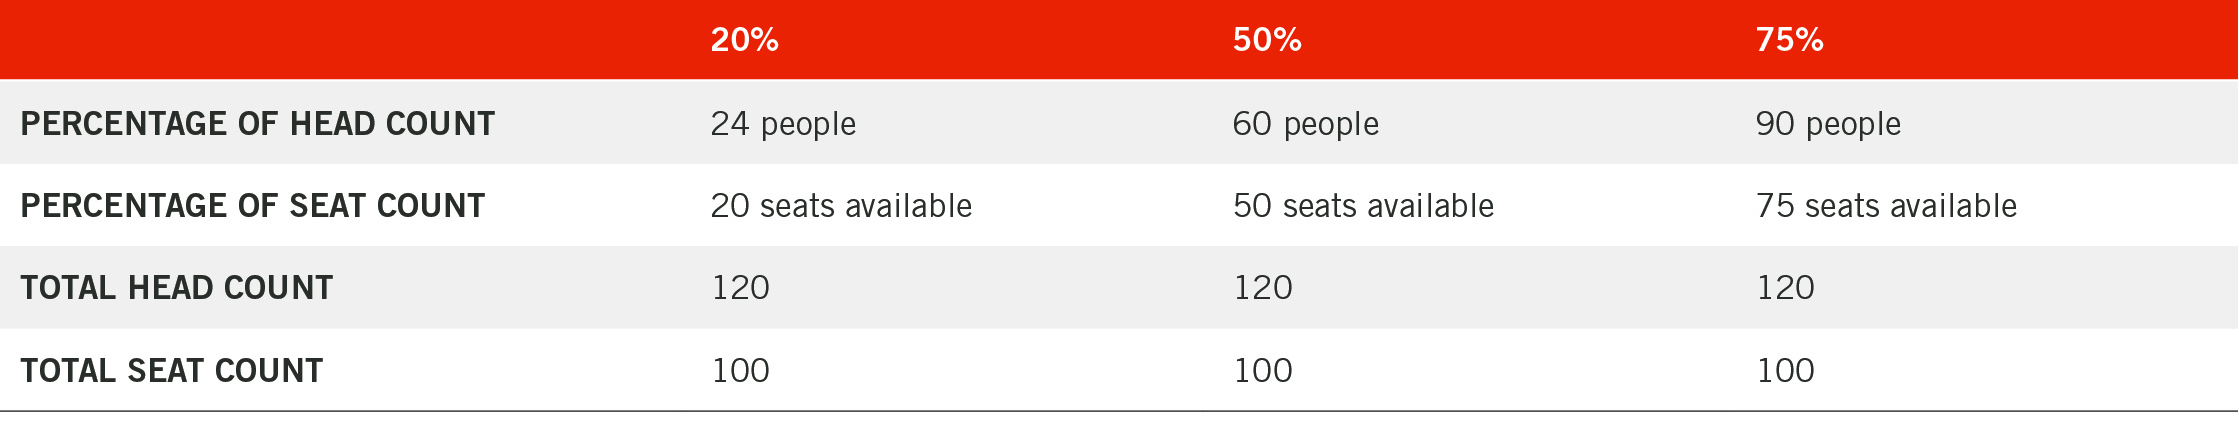
Figure 3: Chart calculating capacity at 20-50-75% for 1:1.2 mobility ratio
Workplace Standards and Eligibility
Prior to COVID, organizations were decreasingly defining space eligibility criteria, thanks in large part to mobility programs (JLL, 2020). Post COVID, as the workforce continues to routinely work remotely, in-office workplace standards will devolve according to organizational culture and business demands. As the use of un-assigned workstations and on-demand offices accelerate, workspace eligibility based on level and title will likely reduce along with the number of workplace standard types.
Space Allocations and Charge Backs
The amount of space assigned to a Business Unit (BU) is charged back in 75% of responding North American organizations reported in a recent JLL survey (JLL, 2020). The predominant space allocation methods, rentable SF utilized and headcount by BU, are largely assessed annually. Common space and meeting/collaboration spaces are often prorated to all BUs. Vacant space allocations, pre-COVID, were often charged back to the BU which they were assigned. The post-COVID allocation scheme will likely see updates to these practices.

Photography Credit : Chipper Hatter
Factors and Rules of Thumb
Circulation Factors (CF) = Circulation SF ÷ USF (Useable SF). Historically consistent at 20-30% CFs have been increasing as Activity Based Work (ABW) environments become more prevalent. Characterized by increased amounts of open collaboration spaces and fewer smaller individual work seats, CFs in ABW floor plans often hover in the 40-45% range. As the post-COVID office plan is developed, Circulation Factors will need to be re-examined based on the organizational goals of the space.
The WE and ME space mix, defined by the proportion of space dedicated to individual workstations (Me) and to collaborative spaces (We), has been changing. A decade ago, 70% Me and 30% We space was common. As additional open and enclosed collaboration spaces of all sizes have been incorporated, the Me/We ratios approached 50/50. And in some ABW environments, the proportion of We space has eclipsed the amount of Me space. At least for the short term, COVID will re-adjust this proportion for a greater emphasis on Me space.
The ratio of private offices to open workstations has been decreasing. Legacy proportions of 25% private offices to 75% workstations have been evolving with 10% private offices to 90% workstations not uncommon. Initiatives like reserving an office for the day, may slow the decline of private offices, as the long-term impacts of COVID on individual spaces are still uncertain.
Add on Factors represents the building common space proportionally allocated to all tenants of the building. Typically, Class A, amenity-rich buildings have higher Add on Factors, as those common spaces must be prorated to all rentable tenant spaces. With COVID closing many office building amenity spaces (e.g. gyms, lounges, conference centers, etc.), FMs have the opportunity to explore what spaces are essential to their employee experience and business objectives.
Contact Tracing
With access to workplace floor plans and personnel seat assignments, FMs play a key role in contact tracing, defined by the Centers for Disease Control and Prevention (CDC) as “letting people know they may have been exposed to COVID-19, that they should monitor their health for signs and symptoms of COVID-19 and helping people who may have been exposed to COVID-19 get tested,” (CDC, 2020).
The process for contact tracing for employees, contractors or visitors, whether supported by badge data, pre-registration reports or reservation software generated, typically includes a self-screen, seat selection, check-into work seat, and the reporting the bookings of meeting spaces.
Conclusion
There are many workplace metrics available for the FM to measure and even more ways to use this data for COVID workplace planning. The new ecosystem of choice and mobility has made analysis even more complex. Establishing consensus with the Executive Team on what to measure and educating the FM team on the new realities of space allocation is a good way to start. Engaging a qualified Workplace Strategy and Occupancy Planning team will ensure good data to support informed decision making. The dichotomy, uncertainty and ambiguity of COVID’s impact on workplace metrics is an opportunity for FMs to use data to manage this disruption.
References
Centers for Disease Control and Prevention-CDC, (2020, September 17), Contact Tracing, Retrieved from: https://www.cdc.gov/coronavirus/2019-ncov/daily-life-coping/contact-tracing.html
Jones, Lang, LaSalle-JLL, (2019-2020), Occupancy Benchmarking guide. Retrieved from: https://www.us.jll.com/content/dam/jll-com/documents/pdf/other/jll-us-the-2019-2020-occupancy-benchmarking-guiide.pdf
About the Author
Cynthia Milota has held roles as educator, designer, project manager, end-user and workplace researcher. She is currently the Director of Workplace Strategy at Ware Malcomb. Always starting with the unique objectives of her clients, she integrates research and change methodologies for measurable outcomes. Her work scales from enterprise-wide portfolios to single occupiers, enhancing employee experience and delivering work environments that support business demands.