One of the most underutilized benefits from benchmarking is its use to develop staffing levels for existing or new facilities. Most projects focus on the construction costs and other aspects of the occupancy process such as furniture, the move in, and equipment. Completely overlooked in many cases are the staffing plans to maintain the facility. If you are already operating a facility, you may feel short-staffed but how can you prove it?
Did you know that data entered in a benchmarking system can be used to determine your staffing levels for all of your maintenance, janitorial and security operations? For the building life, operating costs often represent more than 90% of the life-cycle costs and the appropriate staffing levels have a significant impact on the overall condition of the facility.
Using benchmarking is a straightforward process that shows the importance of the FM position in the organization and the impact of staffing decisions over the life-cycle of the building. Without good benchmarking comparisons you may not realize that staffing levels may need to be increased or decreased, your level of service is too low, or which best practices may have the most impact on improving the staff utilization. As you can see, a case easily can be made for benchmarking that will justify the minor amount of staff time.
We have used examples from FM BENCHMARKING to illustrate how easy the process should be. This approach will allow you to obtain the key output reports in minimal time. In the following example, we benchmarked an office facility for maintenance staffing levels.
Comparing your maintenance staffing levels may give you the wrong perspective on your performance unless the comparisons are made with a relevant peer group. For a quick analysis of a 400,000 GSF building that is under construction we can utilize FM BENCHMARKING LITE to create a chart showing the area maintained per full time maintenance worker.
For maintenance staffing, when looking at the area maintained per worker, Figure 1 shows:
- First quartile performance of 70,285 GSF per FTE worker.
- Median performance of 61,800 GSF per FTE worker.
- Third quartile performance of 55,600 GSF per FTE worker.
Most FM’s would probably prefer to staff up over time. A staffing plan that moves into the facility with the minimum staff and increases staff if needed is most appropriate for most organizations.
A prudent staffing plan would be to utilize the first quartile value of about 70,000 maintained GSF per worker. So for a 400,000 GSF building you would need about 6 maintenance workers. How they are allocated among the trades would depend in part on the quality of the construction. You would most likely staff for a combination of electricians, HVAC/mechanical, controls, and general trades. Using benchmarking data in this way provides a rational and easily defended approach to developing a staffing plan.
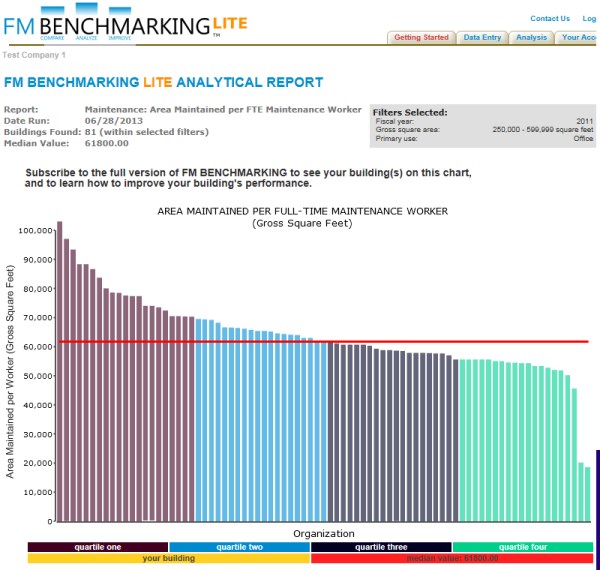
Filters: Type of facility (Office); Size 250,000 — 599,999 SF
The case can be made to focus our efforts on implementing the key aspects that will influence the overall operating costs and improve the efficiency of the staff. Maintenance services are compared on a cost per area basis. Using FM BENCHMARKING LITE provides an idea of the performance of a good peer group, but it doesn’t directly show their building’s performance or provide a table of the implemented best practices by quartile; i.e., it doesn’t show which best practices are being done by the better performing buildings that are similar. For that we need the full version of FM BENCHMARKING (as opposed to LITE).
Let’s assume that immediately after you open the facility, you learn that the staffing plan is too light. To operate the building successfully, you determine that you need to staff at the third quartile levels but management will not let you stay there for long. To assure that our new facility reaches the first quartile’s performance levels, you could start reducing costs by reducing staff and limiting the purchase of new parts and equipment. However, this usually isn’t too effective. Typically, the quality of the services will decline and you will start receiving more complaints and eventually your costs will increase excessively.
A much better approach would be to develop a strategy to staff at the first quartile performance level in a set period of time, and then continue to consider more of the essential best practices until the organization is at first quartile performance. An important step is to evaluate which best practices other organizations in this peer group have implemented to reach the first quartile. Figure 2 shows some of the best practices you have implemented in our sample building, what has been implemented by the peer group in your quartile (3rd) and the next better quartile (2nd). This is only a partial list from FM BENCHMARKING, there are about 30 best practices overall.
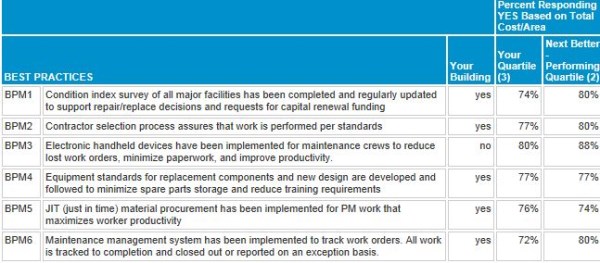
Filters: Primary Use: Office; Size 250,000 — 599,999 SF
Using the results from this table, the facilities group can make proven recommendations for maintenance services that would help achieve first quartile performance. For example, of the best practices listed in Figure 2, there is only one that is not in place in your building—use of electronic handheld devices for maintenance crews. Yet, 80% of those in your quartile and 88% of those in the next better quartile (2nd) have implemented these. That becomes a compelling reason for you to consider them in your facility.
Again, this is win-win for both the construction process and the FM. The owner will achieve cost savings from the maintenance improvements and improved levels of service; the contractor will improve its profitability by utilizing the benchmarking process more effectively, and there will be improved occupant satisfaction which benefits everyone.