Every organization goes through staffing scrutiny; the facilities organization is no exception. Staffing questions create an inordinate amount of anxiety in nearly every organization. By using benchmarking, facilities managers can prepare for this in a logical and planned way to minimize disruption to their organization. Benchmarking the staffing component is probably one of the easiest and most straightforward pieces to any benchmarking exercise.
What is needed? Most surveys will collect their staffing benchmarks on a full-time equivalent (FTE) annual basis. Depending upon the level of detail, the surveys could ask for:
- Total staff
- Staffing by internal and contract workers
- Staffing by various disciplines such as electricians, plumbers, HVAC, mechanics, etc.
It is our experience that most organizational staffing level questions come down to total staffing levels. Senior management is most likely to set an FTE level for the organization and leave the details of how it is staffed to the facilities management leadership team. Therefore, it is probably sufficient to benchmark either by total staff or by internal-plus-contract workers.
Determining and keeping the appropriate staffing levels is probably one of the more critical decisions that facilities managers and the senior leadership team can make. The work of the department, the goodwill of the end-users and the overall quality of the facility all depend on the FM staff. If you try to maintain a facility with too small of an organization, the overall quality of the work will suffer. With too large of an organization, funds are wasted and senior management will have a poor perception of the leadership team.
A benchmarking example illustrates how easy and valuable the process should be. This approach allows you obtain the key output report of staffing by major components such as:
- Maintenance
- Janitorial
- Security
Figure 1 shows the staffing level performance for our facility (shown in yellow, in the green-area of the chart) compared with a group of facilities that most closely matches our own. This allows you to see at a glance how our facility compares with other office buildings that are greater in size than 600,000 gross square feet. The overall performance ranges from over 100,000 SF maintained per person to about 55,000 SF maintained per person. First quartile performance is about 65,000 SF per person or greater and median performance is 61,000 SF per person.
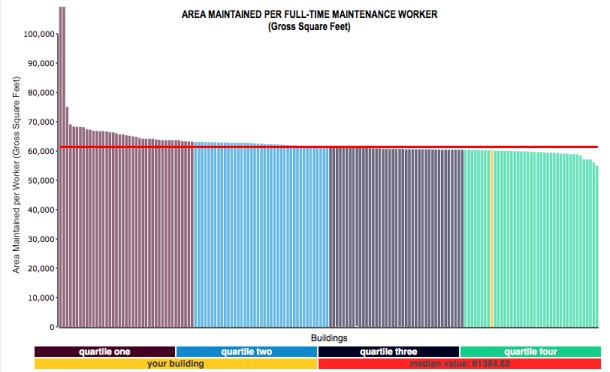
Filters: Type of facility: office, greater than 600,000 GSF.
Provided courtesy of FM BENCHMARKING.
Note that if we remove the outliers at the left-most side of the chart, we see a more regular curve, ranging from around 70-75,000 SF per person down to 55,000 SF per person. When benchmarking, one should always be careful to allow for unique circumstances of individual buildings. There could be several reasons for the outliers at the beginning of the chart, such as much more open plan facilities or reduced maintenance tasks (the latter could result in significantly higher maintenance costs down the road!). The lesson from the information in this paragraph is to use the data smartly.
We see that our maintenance staffing is in the fourth quartile (the green area to the right). Unless there are extenuating circumstances, it would appear that the maintenance organization is staffed higher than needed to effectively operate the facility. Note the organization is not extensively overstaffed. The facility size is 1.2 million SF. A realignment of two FTEs would bring the organization and the first quartile performance.
We should very carefully examine the causes of this performance by breaking down the staffing details into the major subcategories; i.e. the areas they are maintaining, such as plumbing, HVAC, etc. Once we understand which staffing level components are the causes of this performance we can develop an action plan to deal with it. In any event, we are in a much better position to manage the facility in a proactive way than prior to the benchmarking initiative.