In last month’s article we reviewed how utility costs nearly always seem to be one of facilities managers’ top issues. The reasons are simple:
- Utility costs typically are the largest single expense of any operating budget – usually between 30 to 35% of total operating costs.
- Utility rates are rising and in many areas quite quickly. This is due to a variety of factors beyond the control of facilities managers such as increased pollution controls, investments in renewables, storm hardening.
- FMs are faced with increasing corporate initiatives to reduce greenhouse gas emissions and become better environmental stewards.
Many FMs report that they feel like they are not gaining much on their cost reduction initiatives. It is often reported by FMs that the efficiency initiatives are met with corresponding rate increases so the expenditures are often nearly the same.
Benchmarking is still a useful initiative and perhaps even more so with initiatives to report the carbon footprint of the facility. I recently attended a conference where most of the participants reported that they have carbon footprint reduction initiatives ranging from 30 to 80 percent over varying timelines. The interesting observation was that all were meeting their goals and attributed their success to the energy efficiency programs they had implemented.
So here is a success story that FMs should be eager to report. Yet, carbon footprint metrics are often overlooked by FMs and some benchmarking applications do not even include it. It is a surprisingly easy one to measure; if you are collecting your utility consumption any benchmarking application can calculate the carbon footprint.
Figure 1 shows a partial screen shot of annual utilities consumption. Each value listed with the legend “CF” is needed to calculate the carbon footprint.
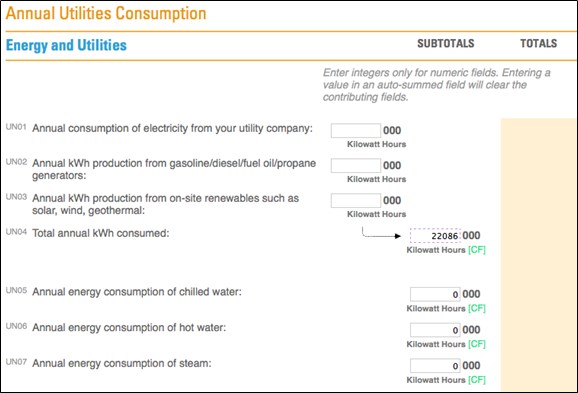
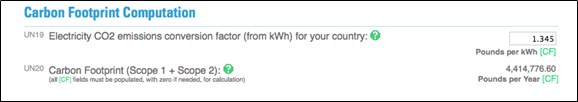
From this information we can calculate our total carbon footprint, as shown in Figure 2.
With this data any benchmarking system should be able to provide a normalized carbon footprint comparison based on utility consumption. This kind of benchmarking system shows where you stand compare to your peers as in the example below (see Figure 3). This chart is filtered for the type of facility: office. Note that our building is in the middle of the fourth quartile and in need of improvement. Implementation of some key best practices is going to be needed to change the results.
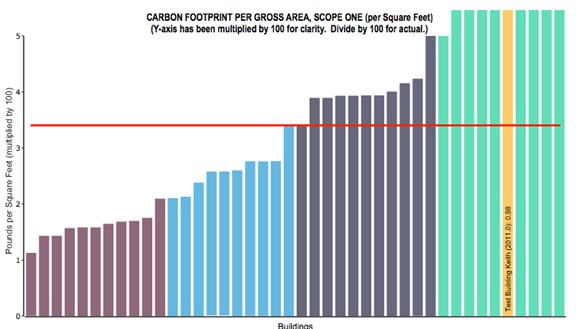
Again, most benchmarking tools should be able to provide this type of report. And, any facility manager looking at this chart should be asking the question, “What do I do to get better, or move into the third or second quartile?”
The same principles should be applied as in the previous article for best practices.