November 2019 — Every FM goes through an annual budget cycle and is usually called upon to justify it. CFOs know they can usually try to cut some of the operating budget and often there isn’t any obvious repercussion. FMs will just “make do” and cut some of the preventive maintenance work to balance the budget. This results in more deferred maintenance that often doesn’t show up for a while.
FMs that think strategically set up their cost systems so they can benchmark their performance on an annual basis and be prepared for budget cuts or even a request for additional funds. Benchmarking is really a straightforward process that involves the input of your operating cost data into a system so you can compare your performance with a peer group. After you have done that, you’re in a position to defend the requested operating budget.
In a typical building, operating costs comprise more than 90% of the life-cycle costs. Using benchmarking is an easy way to show the importance of the FM position in the organization and the impact of budget decisions on operating costs over the life-cycle of the building. With good benchmarking comparisons you can justify the operating costs needed to manage the building in the most effective way possible. If the operating budget is too low, the building components will wear out early in the life cycle forcing premature capital expenditures. If the operating budget is too high, then funds are being wasted that could be used more productively by the organization.
We have a benchmarking example from to illustrate how easy the process should be. This approach allows you obtain the key output report of total operating costs in the minimum amount of time. Total operating costs include:
- Utilities
- Maintenance
- Janitorial
- Security
- Grounds, parking, and paving
- Waste and recycling
The graph in Figure 1, provided by FM BENCHMARKING, shows the combined operating cost performance of our subject facility compared to other office facilities. This allows you to see at a glance how our facility compares to other office buildings. Excluding a few outliers at the low- and high-cost ends of the chart, the overall performance ranges from about $5.50 to $15.00 per gross square foot. Our building’s performance (shown in yellow) is in the third quartile, very near the median at $8.99 per gross square foot.
Let’s assume that the CFO is requesting a 10 percent budget cut. To achieve that, we would need to get the costs down to about $8.10 per square foot, which is about the middle of the second quartile. Is that achievable without severe impacts to the facility? Maybe, if you have developed options for budget reductions. Other buildings have clearly shown that it can be done.
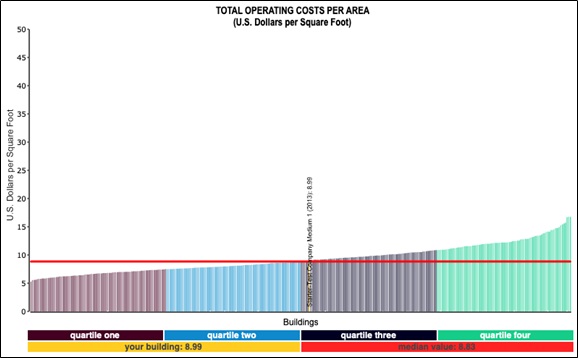
Figure 1 – Total Operating Cost per Area
Filters: Type of facility: Office
Provided courtesy of FM BENCHMARKING
Unless there are extenuating circumstances, it would appear that our budget is higher than needed to effectively operate the facility. However, before we draw this conclusion, we should make sure that the other buildings the are costing less to operate (those in the first and second quartiles) are indeed similar to our building. We can do this by filtering out those that are not similar. For example, if our building is open 24/7, we may want to exclude those that are open for fewer hours per week. Application of this filter alone may eliminate some of the lower-cost buildings, having the net effect of moving our building to the left and into the second quartile.
Once we have applied the relevant filters, we will have a much better idea of our building’s cost performance. At that time, we can determine if one would expect to be able to reduce our building’s operating costs. We then can go about developing a solid action plan to make this happen.