September 2017 – Securing your facility, both the exterior entries and critical or limited access spaces is a difficult task for many FMs. Thieves, vandals, active shooters, disgruntled ex-employees, corporate spies and others can gain access to many facilities simply by walking through unlocked front doors, shipping areas or tailgating at employee entrances. We visit many sites over the course of a year and most employees will even hold the door open for us. After gaining access to the facility, they usually are free to roam most of the facility looking for opportunities. The key to effective security is by controlling access.
The trend, however, is to provide security controls with fewer guards and staff and use more electronic access controls. It is easy to understand why since minimum wages are going up in many locations, and that means staffing for security costs will be rising too. Most FMs are probably contracting for more than the minimum, but the increase flows thru, more or less proportionately to the security workers too. Your security services are probably contracted under a multi-year agreement, but the impact will be felt over the next year with higher attrition rates and price increases when the security contract is up for renewal.
For FMs this issue is difficult to resolve. Most are experiencing cost pressure to find better ways to provide, better, cost effective security services that are oriented toward providing a safe workplace.
It often seems that only poor and poorer choices are available when security budgets need to be reduced:
- Rebid the contract to try and obtain better pricing
- Reduce staffing levels by closing manned access points forcing staff to enter the building at less convenient locations
- Utilize card-readers at unmanned locations, which results in less control and tail-gating by employees, visitors, or thieves.
- Install more cameras, which is not really a security enhancement technique since cameras only provide information after the fact.
There is only so much that can be cut and still have a safe facility that meets corporate and employee requirements. Many attendees at our benchmarking conferences readily admit that security needs improvement and would like to do something to improve the service. There just should be a better way than cutting and reducing the service levels and impacting the employee experience. If this describes your security organization, let’s look at ways this can be changed.
Security benchmarking can help you understand how your costs compare with others in your peer group and may be able to help you justify additional budget funds. Most FMs are familiar with benchmarking concepts. You enter your cost data, occupancy and building area. From this data, a good benchmarking system should be able to provide a normalized cost comparison for security services. This kind of benchmarking system shows where you stand compared to your peers.
Figure 1 shows how much the security services cost for your building on a normalized basis in comparison with other office facilities. There are 385 buildings in this peer group with a median security cost per gross square foot of $1.29 and a first quartile performance of 1.10 per gross square foot. Our security cost is above the median, in the third quartile, shown in yellow, with a cost of $1.40 per gross square foot.
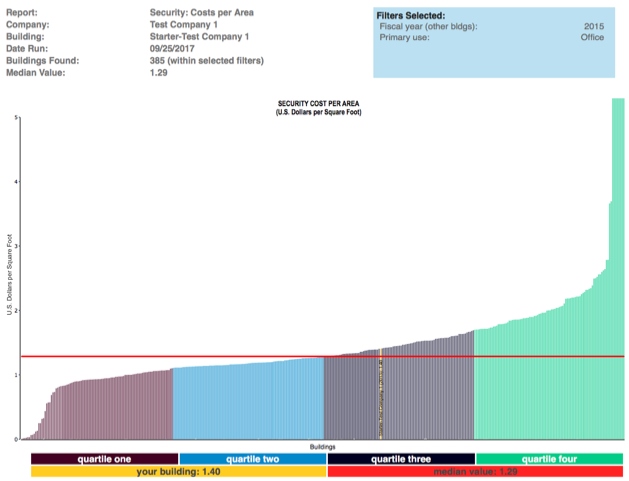
Filters: Office Facilities
Provided courtesy of FM BENCHMARKING
A facility manager or security manager looking at this chart would probably ask the question, “What do I do to get better, reduce costs, and improve the overall security levels in and around my facility?” The costs are relatively high, and we know that security costs are mostly labor, so we should be looking at options that would better utilize the security workforce. Let’s see how we compare with the workforce utilization rate.
Figure 2 shows the area secured by security worker compared with other office facilities. There are 344 buildings in this peer group with a median area secured of 14,159 gross SF/security worker and a first quartile performance of 15,769 gross SF/security worker. Our facility performance is above the median, in the third quartile, shown in yellow, with a performance of 12,941 gross SF/security worker.
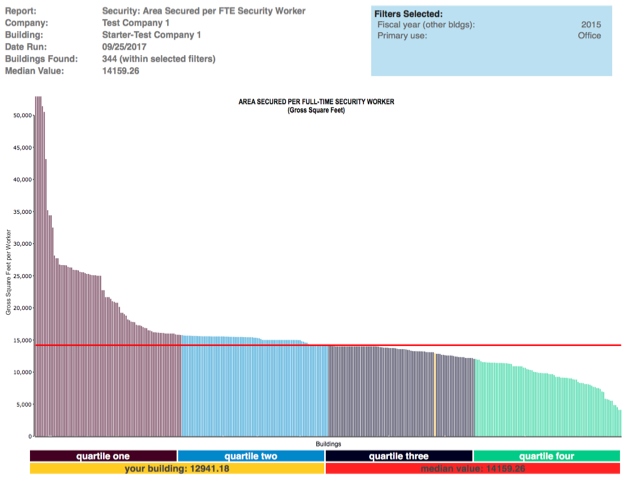
Filters: Office Facilities
Provided courtesy of FM BENCHMARKING
The chart shows that we are high on the number of security workers but in a similar place on the benchmarking graph compared with costs. To see what we can change to improve performance look next at what “best practices” could be implemented.
A benchmarking tool that incorporates best practices will provide you with the information to answer that question. Figure 3 identifies five best practices from the FM BENCHMARKING application for security services.
There are 16 security best practices, but these five illustrate how the application can be used to “tune up” the security performance. Best practices are a way to compare what others are doing in your quartile and the next better-performing quartile.

Filters: Office Facilities, Size 125,000-250,000 GSF
Provided courtesy of FM BENCHMARKING
From observation, we already think the security staff spends too much time asking employees to put on their badges. A policy should be developed to make this a requirement and disciplinary action taken for employees that do not wear a badge.
Consider SB02 in Figure 3 above, “More than 80% of the guard force is certified.” This best practice has not been implemented (see the third-to-last column) and security work is not always performed to industry standards. Since only 64% of the companies in the third (my) quartile have implemented this best practice, while 80% of those in the second quartile have done so, we see that there is a 16% increase in this measure alone from the third quartile to second quartile performance. Thus, besides seeing that nearly everyone in the second quartile is doing this best practice, the 16% indicates that this also would be a good way for us to get our building into the second quartile.
These are just a few examples but the technique can be applied to all security best practices. Clearly, using the best practices tables is a good way to improve the overall quality of the service delivery by seeing which best practices will have the greatest positive impact on our building. By applying these, you are sure to improve your performance.